HomeDiagramsDatabaseMapsForum About
     

Go Back   SkyscraperPage Forum > Discussion Forums > City Discussions


Reply

 
Thread Tools Display Modes
     
     
  #141  
Old Posted Jul 9, 2026, 4:20 PM
iheartthed iheartthed is offline
Registered User
 
Join Date: Oct 2009
Location: New York
Posts: 11,952
Quote:
Originally Posted by sopas ej View Post
I just looked it up; during the Great Depression, Detroit was heavily into the Mexican Repatriation program, which was supported by the federal government, but was largely organized by city and state governments. And of course in car industry Detroit, they saw it as a form of "job protection" for whites.

My guess is after that, Hispanics were less likely to move to Detroit. Kind of like how some SoCal suburbs that were sundown towns still have low African-American populations; the older generations told of horror stories about, say, Glendale.
Probably some combination of this and the plateauing of the Detroit area economy in the 1960s.

Metro Detroit is relatively unique among U.S. metros in that Hispanic is not either the largest or second largest minority group. Nor is Latin America the largest source of foreign-born population, as is typical for most major U.S. metros. In most other metros a Latin American country is usually the largest source of foreign-born population, but not in Metro Detroit. The top 5 countries of birth for foreign-born in Metro Detroit area are in order India, Iraq, Mexico, Yemen, and Lebanon. In Chicago it is Mexico, India, Poland, China, and the Philippines.
Reply With Quote
     
     
  #142  
Old Posted Jul 9, 2026, 4:32 PM
Docere Docere is online now
Registered User
 
Join Date: Jul 2014
Posts: 8,869
Of the large US metros (say 2 million+) I'm guessing Pittsburgh would probably have the lowest foreign born percentage or close to it.
Reply With Quote
     
     
  #143  
Old Posted Jul 9, 2026, 5:19 PM
Docere Docere is online now
Registered User
 
Join Date: Jul 2014
Posts: 8,869
Share of world population by continent/region:

Asia 59.4%
Africa 17.6%
Americas 13%
Europe 9.4%
Oceania 0.6%

A bit more detailed breakdown:

East and Southeast Asia 29.5%
South Asia 25.2%
Sub-Saharan Africa 14.4%
Europe 9.4%
Latin America and the Caribbean 8.3%
Middle East, North Africa and Central Asia 7.9%
Northern America 4.7%
Oceania 0.6%
Reply With Quote
     
     
  #144  
Old Posted Jul 9, 2026, 5:30 PM
Steely Dan's Avatar
Steely Dan Steely Dan is online now
devout Pizzatarian
 
Join Date: Jul 2001
Location: Lincoln Square, Chicago
Posts: 30,329
Quote:
Originally Posted by iheartthed View Post
Probably some combination of this and the plateauing of the Detroit area economy in the 1960s.
I think the post-war economic trajectories probably played a bigger role.

While the City of Chicago did not directly participate in the Mexican Repatriation program during the Great Depression, the depression itself led thousands of Mexicans here to self-deport back to Mexico. Estimates say Chicago's Mexican community went from ~25,000 in 1929 down to ~16,000 by 1938.

Source: http://www.encyclopedia.chicagohistory.org/pages/374.html


It was after The War that the influx of Mexicans into Chicago started going in to hyper-drive.
__________________
"Missing middle" housing can be a marvelous middle ground for many middle class families.

Last edited by Steely Dan; Jul 9, 2026 at 5:48 PM.
Reply With Quote
     
     
  #145  
Old Posted Jul 9, 2026, 5:48 PM
Docere Docere is online now
Registered User
 
Join Date: Jul 2014
Posts: 8,869
Not surprisingly the percentage born in the Americas is higher in US cities (often a majority of the immigrant population), while Sub-Saharan Africans are proportionally underrepresented. Washington however matches the world share of the population and has the largest population of immigrants for Sub-Saharan Africa (New York a close second, but obviously underrepresented relative to world population).

Born in Sub-Saharan Africa:

Washington 222,072 14.5% of foreign born
New York 215,791 3.6% of foreign born
Reply With Quote
     
     
  #146  
Old Posted Jul 9, 2026, 6:04 PM
iheartthed iheartthed is offline
Registered User
 
Join Date: Oct 2009
Location: New York
Posts: 11,952
Quote:
Originally Posted by Steely Dan View Post
I think the post-war economic trajectories probably played a bigger role.

While the City of Chicago did not directly participate the Mexican Repatriation program during the Great Depression, the depression itself led thousands of Mexicans here to self-deport back to Mexico. Estimates say Chicago's Mexican community went from ~25,000 in 1929 down to ~16,000 by 1938.

Source: http://www.encyclopedia.chicagohistory.org/pages/374.html


It was after The War that the influx of Mexicans into Chicago started going in to hyper-drive.
Yes, the economy was absolutely the biggest factor but there were some other things at play that helped to destabilize the existing ethnic communities (Mexican, Puerto Rican, Chinese). Detroit's Mexican population likely peaked in the 1950s or 1960s along with the city's overall population (but before the black population peaked). The construction of I-75 in the late 1950s took out large swathes of Mexicantown in Southwest Detroit, and that would limit where a growing Mexican population could live in the city at the time. There was also a sizable Puerto Rican population that lived adjacent to Mexicantown which might have caught the brunt of the removals for freeway construction. That likely factored into the attractiveness of Detroit as a destination for the growing Puerto Rican communities on the mainland. A similar thing happened to Detroit's Chinese neighborhoods which also never really recovered.
Reply With Quote
     
     
  #147  
Old Posted Jul 9, 2026, 6:17 PM
Docere Docere is online now
Registered User
 
Join Date: Jul 2014
Posts: 8,869
Pretty strong North / Sunbelt split (not surprisingly) for European share of immigrant population. Basically overrepresented in Northeast and Chicago, and underrepresented in the south and west.

Number and percentage born in Europe:

New York 823,903 13.8%
Chicago 352,351 20.2%
Los Angeles 226,394 5.3%
Miami 150,821 5.7%
Boston 148,855 15%
San Francisco 129,093 8.7%
Washington 115,090 7.5%
Houston 79,210 4.4%
Dallas 66,549 4.3%
Reply With Quote
     
     
  #148  
Old Posted Jul 9, 2026, 9:41 PM
muppet's Avatar
muppet muppet is offline
if I sang out of tune
 
Join Date: Sep 2004
Location: London
Posts: 6,528
Quote:
Originally Posted by New Brisavoine View Post
Currently the London FUA is less than 1 million inh. smaller than the Paris FUA, but it we used a 40-50% threshold it could easily be 2.5 million inh. smaller than the Paris FUA.


And Newbury ISN'T part of the London FUA, precisely because too few people commute to London.


You've answered the question yourself. If western areas are dense, that means they have their own strong urban centers that work independently from London. Rural areas, on the other hand, don't have strong urban centers, and are therefore entirely attracted by London.


You can walk from the Dutch border to the French border all along the Belgian coast without ever leaving built-up streets I believe, yet that doesn't make it a giant city of 50 km.
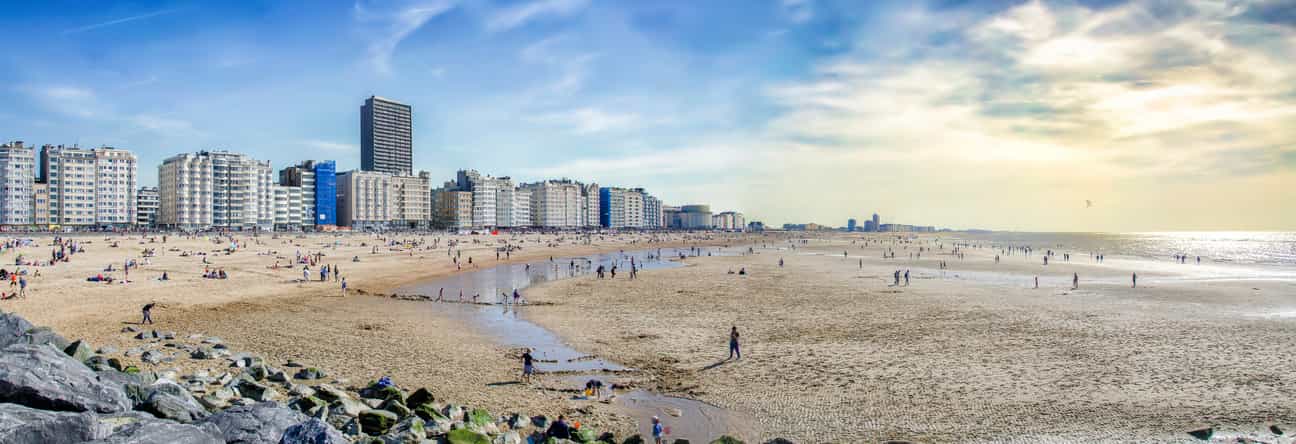
And once again, if you're to put the threshold higher and London goes lower so be it - I would recommend that. I'd still stand by it as I don't think 15% of commuters out in the styx a city maketh.


The west very definitely commutes into London, if not more than the little villages in the north east. However the paradox is that because its so dense and functioning in their own they get hijacked out of the count. This is why Slough is excluded despite contiguity and sending in 30% of its population. Similarly Maidenhead and Twyford at 40%, because they're too near Reading, St Albans at 50% because it's considered its own nexus by administrating Hatfield and Welwyn Garden City alongside.

Also the building block effect means different types of units decide vastly different outcomes. This is the main reason for the disparities.

Many UK towns get excluded because their Local Administrative Unit (LUA) will not be deemed contiguous, eg separated by an empty patch of field or forest. Such as Woking at 65% and Brentwood at 40% commuters, near to London, but whose Local Authority will happen to include large rural areas, and thus deem them too 'low density'. Despite Woking with over 100K and Brentwood 55K populations.
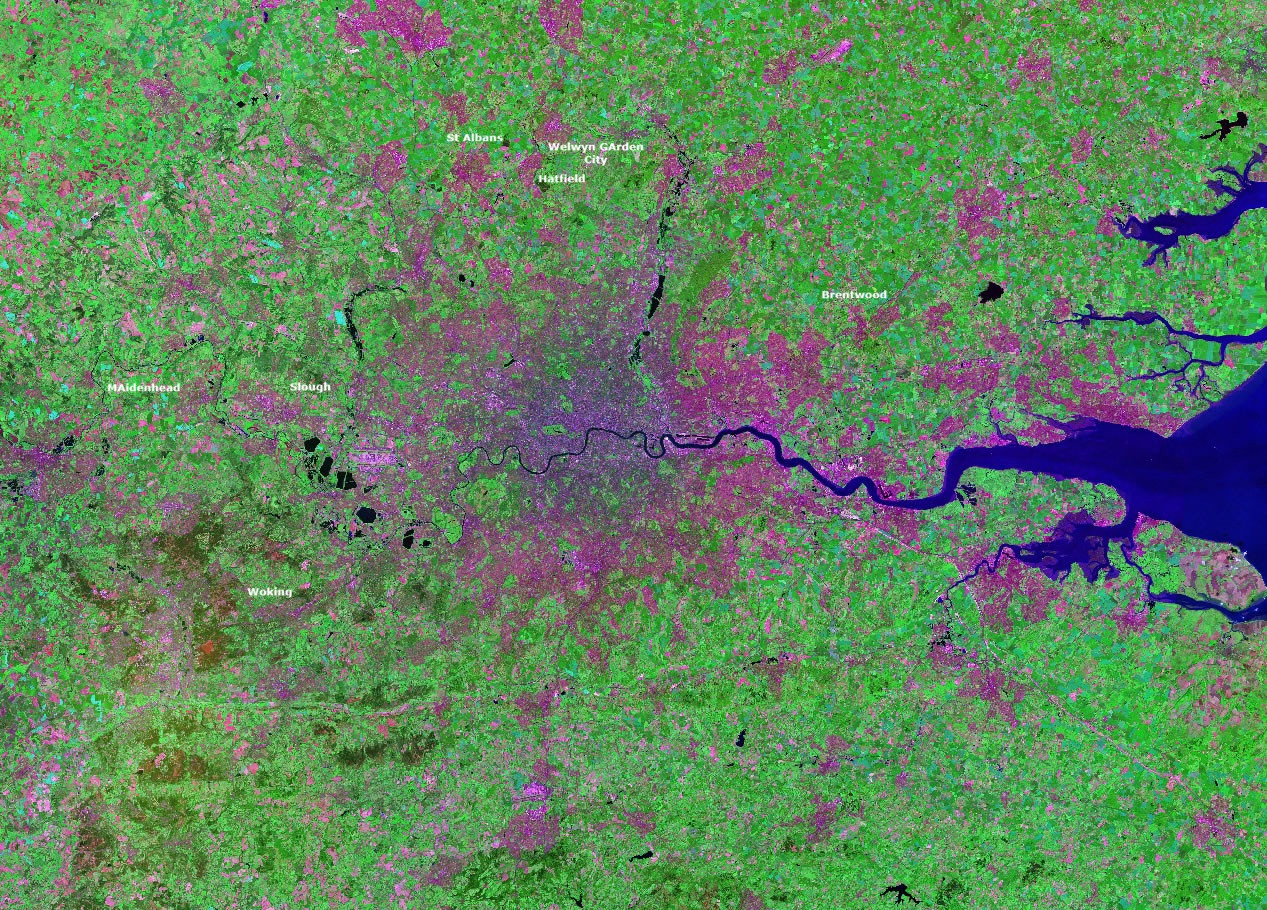


Yet that is the same for many other cities round the world right? -being separated from the main by patches of countryside in between?


Well no, because other places can get them bypassed. In the US their LUA's will be based on counties. That's a considered a single unit despite some as large as 2360 sq km (50% larger than Greater London), and who'll get everyone in there counted, including the huge tracts between settlements -it'll all be considered 'contiguous'. This is how it ends up the size of Wales and some.

Paris gets round this (rightly so) because it uses communes, high density and very small, but that knit together and around what would otherwise be blocking if larger, i.e. London's larger local authority size. It doesn't inflate anything like the US style of counting, and nowhere near that size, but you can see from the density of the map above how a similar unit area could have differing results for London.


In other words the whole FUA methology strives to be equal, but it simply cannot without a standard unit, if its building blocks are of different sizes and criteria.


For the mostly Belgian coastline -then yes, it absolutely does make it one unit (although I have to say, it's a tad gappy in the east, and very suburban and holiday-homey most everywhere else). Southern England has similar which is why Brighton has a population of 290K in one book for its city proper, and 640K in others, but as mentioned also gappy at its sides. Without those gaps I'd definitely consider them one city, or at least one entity.


The Brighton-Hove Built Up Area is considered a unit, and 40km long, (but stopping before Peacehaven in the east, it could continue to 53km if allowing gaps).
It has a spine of transport (note the South Coast Line), and what effects one town has a ripple effect on the others, such as the current housing crisis. As the authorities realised it functioned as one city, they created the Sussex and Brighton Strategic Authority to unify leadership, quell the squabbling and coordinate the services:
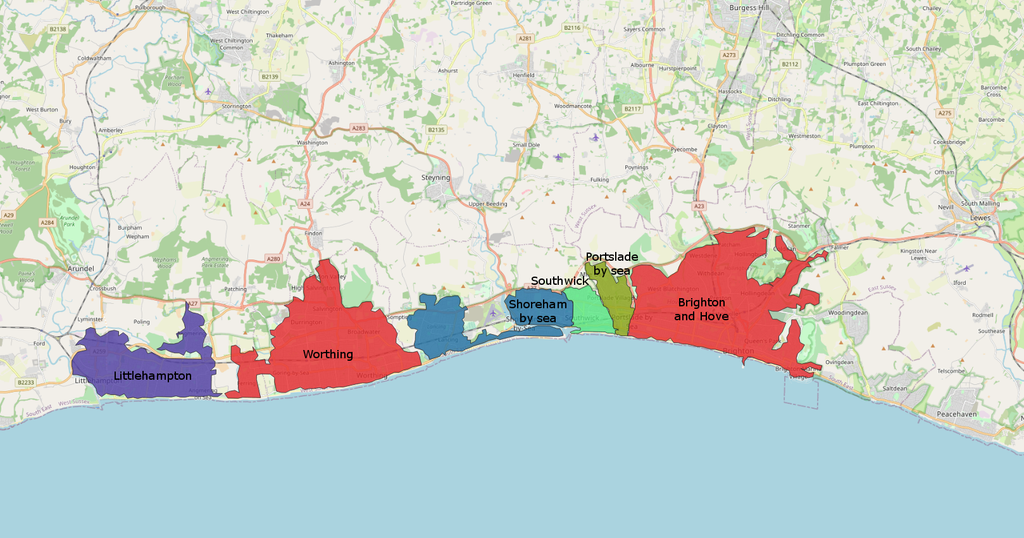


My main point through is to walk on city streets surrounded by buildings either side from one end to the other -once again there's no physical or even administrative barrier stopping people doing this. Tokyo-Yokohama, Guangzhou-Foshan, Los Angeles-Long Beach, Osaka-Kobe.


Last edited by muppet; Jul 9, 2026 at 11:48 PM.
Reply With Quote
     
     
  #149  
Old Posted Jul 9, 2026, 10:39 PM
Docere Docere is online now
Registered User
 
Join Date: Jul 2014
Posts: 8,869
I have to agree a bit, even though there are indeed metrics behind the FUA. Slough separated from London but Baltimore joined with Washington and Providence with Boston doesn't sit quite right. BTW I presented some London commuting data (albeit dated) here:

https://skyscraperpage.com/forum/showthread.php?t=263250&page=2
Reply With Quote
     
     
  #150  
Old Posted Jul 9, 2026, 11:06 PM
muppet's Avatar
muppet muppet is offline
if I sang out of tune
 
Join Date: Sep 2004
Location: London
Posts: 6,528
Thanks Docere, don't worry about us nerds deep diving over one random point -it's just background stuff, like a side-quest.

And every country will have different criteria through no fault of their own (UK for example locked in its Local Authority size, and declined having a standard EU option). Please carry on with your stats!
Reply With Quote
     
     
  #151  
Old Posted Jul 9, 2026, 11:17 PM
Docere Docere is online now
Registered User
 
Join Date: Jul 2014
Posts: 8,869
Atlanta-Sandy Springs-Roswell, GA Metro Area (2024 5-year estimates)

Foreign born 950,480

Europe 69,018
Asia 309,115
Africa 120,022
Americas 449,514

Mexico 142,305
India 99,092
Jamaica 48,408
Vietnam 38,439
China 37,317
South Korea 37,128
Nigeria 29,243
Guatemala 29,209
Venezuela 25,202
El Salvador 23,351
Ethiopia 19,751
Honduras 19,424
Brazil 18,878
Haiti 18,355
United Kingdom 15,514
Canada 13,514
Cuba 10,157
Dominican Republic 10,057
Trinidad and Tobago 8,363
Philippines 12,995
Ghana 9,764
Pakistan 9,342
Bangladesh 8,919
Germany 8,660
Peru 8,468
Trinidad and Tobago 8,363
Guyana 8,335
Kenya 7,953
South Africa 5,849
Japan 5,678
Nicaragua 5,616
Taiwan 5,245
Russia 5,101

# 50000+: 2
# 20000+: 10
# 10000+: 18
# 5000+: 33
Reply With Quote
     
     
  #152  
Old Posted Jul 9, 2026, 11:36 PM
Docere Docere is online now
Registered User
 
Join Date: Jul 2014
Posts: 8,869
Seattle-Tacoma-Bellevue, WA Metro Area (2024 5-year estimates)

Foreign born 853,800

Europe 116,905
Asia 465,047
Africa 69,236
Oceania 17,155
Americas 185,547

India 106,441
Mexico 94,963
China 85,159
Philippines 54,992
Vietnam 53,039
South Korea 42,244
Ukraine 29,530
Canada 26,913
Ethiopia 17,713
Russia 15,513
Taiwan 14,705
United Kingdom 13,685
Japan 12,973
Kenya 12,387
Cambodia 10,103
Germany 9,728
El Salvador 9,637
Iran 9,453
Brazil 9,046
Hong Kong 8,691
Thailand 8,102
Afghanistan 7,797
Somalia 7,439
Guatemala 6,350
Colombia 5,979
Romania 5,909
Honduras 5,512
Iraq 5,187
Pakistan 5,072

# 50000+: 5
# 20000+: 8
# 10000+: 15
# 5000+: 29
Reply With Quote
     
     
  #153  
Old Posted Jul 9, 2026, 11:50 PM
Docere Docere is online now
Registered User
 
Join Date: Jul 2014
Posts: 8,869
Philadelphia-Camden-Wilmington, PA-NJ-DE-MD Metro Area (2024 5-year estimates)

Foreign born 742,429

Europe 118,197
Asia 299,770
Africa 81,630
Americas 88,081

India 88,353
China 54,649
Mexico 49,265
Dominican Republic 38,382
Vietnam 28,197
Jamaica 23,204
South Korea 22,757
Philippines 21,203
Ukraine 17,620
Haiti 16,451
Brazil 16,434
Liberia 15,247
United Kingdom 15,010
Nigeria 13,215
Russia 10,734
Bangladesh 10,478
Germany 10,361
Colombia 10,296
Italy 10,199
Pakistan 9,739
Canada 9,712
Cambodia 7,616
Poland 7,514
Ecuador 7,373
Turkey 6,692
Egypt 5,846
Venezuela 5,812

# 50000+: 2
# 20000+: 8
# 10000+: 19
# 5000+: 27

Last edited by Docere; Jul 10, 2026 at 1:51 AM.
Reply With Quote
     
     
  #154  
Old Posted Jul 10, 2026, 12:01 AM
Docere Docere is online now
Registered User
 
Join Date: Jul 2014
Posts: 8,869
Detroit-Warren-Dearborn, MI Metro Area (2024 5-year estimates)

Foreign born 467,634

Europe 83,223
Asia 275,384
Africa 19,523
Americas 88,081

India 61,618
Iraq 51,883
Mexico 37,470
Lebanon 25,345
Yemen 23,242
Canada 21,504
Bangladesh 20,469
China 16,738
Philippines 12,504
South Korea 11,083
Poland 8,574
Germany 8,116
Pakistan 8,043
Romania 6,947
Japan 6,717
United Kingdom 6,351
Italy 6,166
Syria 6,121
Ukraine 5,923
Vietnam 5,563

# 50000+: 2
# 20000+: 7
# 10000+: 10
# 5000+: 20
Reply With Quote
     
     
  #155  
Old Posted Jul 10, 2026, 1:23 AM
Crawford Crawford is offline
Registered User
 
Join Date: Nov 2003
Location: Brooklyn, NYC/Polanco, DF
Posts: 34,822
Your regional breakdowns for Philly are actually for Detroit.

Among U.S. metros, DC is highly underrated and Philly is a notable underperformer. DC has really broad, almost Toronto-like diversity, but hidden in sprawl. Philly has notable in-town diversity but suburbs don't have much, besides the standard Indians-in-McMansion typology.
Reply With Quote
     
     
  #156  
Old Posted Jul 10, 2026, 1:56 AM
Docere Docere is online now
Registered User
 
Join Date: Jul 2014
Posts: 8,869
^ Corrected, thank you.

I agree DC is really "under the radar." Maybe because it has no "famous" ethnic enclaves and the diversity is in the suburbs? Of the US metro areas, it's one of only three with at least 50 countries with at least 5000 represented in the foreign born population.
Reply With Quote
     
     
  #157  
Old Posted Jul 10, 2026, 2:27 AM
Docere Docere is online now
Registered User
 
Join Date: Jul 2014
Posts: 8,869
San Jose-Sunnyvale-Santa Clara, CA Metro Area (2024 5-year estimates)

Foreign born 803,235

Europe 57,801
Asia 544,136
Africa 12,957
Americas 183,793

India 142,644
Mexico 128,572
China 106,066
Vietnam 99,285
Philippines 51,180
Taiwan 33,675
South Korea 25,326
Iran 17,494
Hong Kong 12,270
Japan 11,862
Canada 10,248
United Kingdom 8,892
El Salvador 8,807
Colombia 8,638
Russia 8,336
Germany 5,752
Israel 5,653
Ukraine 5,055

# 50000+: 5
# 20000+: 7
# 10000+: 11
# 5000+: 18
Reply With Quote
     
     
  #158  
Old Posted Jul 10, 2026, 10:59 AM
New Brisavoine New Brisavoine is offline
Registered User
 
Join Date: Nov 2007
Posts: 5,119
Quote:
Originally Posted by Docere View Post
I have to agree a bit, even though there are indeed metrics behind the FUA. Slough separated from London but Baltimore joined with Washington and Providence with Boston doesn't sit quite right.
Providence is its own FUA. It is not part of the Boston FUA.
__________________
New Axa – New Brisavoine
Reply With Quote
     
     
  #159  
Old Posted Jul 10, 2026, 11:15 AM
nito nito is offline
Registered User
 
Join Date: Mar 2004
Posts: 2,960
Quote:
Originally Posted by mrnyc View Post
before you inevitably post nyc and other cities a reminder this definition of greater london is 600 sqmi. and nyc proper is 300 sqmi..

wuhl alrighty then carry on.
The total area of London is c.600 sq mi but a quarter of that area is Green Belt which is never going to be developed. It’s a bit like referring to the total area of New York rather than just the land area. Either way, London has a higher population spread across a wider city administrative area, with a larger amount of undeveloped/green space area than New York. Their urban morphologies have developed in different ways with neither being right or wrong.


One point to note – which I think Muppet touched upon – is that the data collection for the numbers in this thread does come with some caveats. Namely that the US figures are from 2024, whilst those for the Australian, British and Canadian cities are 2021, and that for Paris 2022.

As we will all recall, the pandemic was a rather peculiar time that produced short-term and questionable outputs for census/survey data collection. Arguably the Australian, British and Canadian censuses ought to have been delayed to better reflect the abnormal circumstances of the time. For example the travel to work figures in the British census are completely useless (even the ONS notes this) as millions of people stepped into their study rather than drive, cycle or catch a train into the office or factory. There were also some peculiarities on a national and international migration level where people left (some temporarily, some permanently) to get out of London and find space, only to then come back.

Another point to raise is that the UK, like some other countries, experienced a post-pandemic surge in migration. Net migration to the UK in the 12-months to June 2023 hit at a staggering 906,000. That record breaking number has since fallen to the long-term average, but it wouldn’t be factored into these numbers. London, Toronto and Sydney most likely saw astronomical surges. London’s foreign born population could very well have increased by half a million from the 2021 census to 2024.

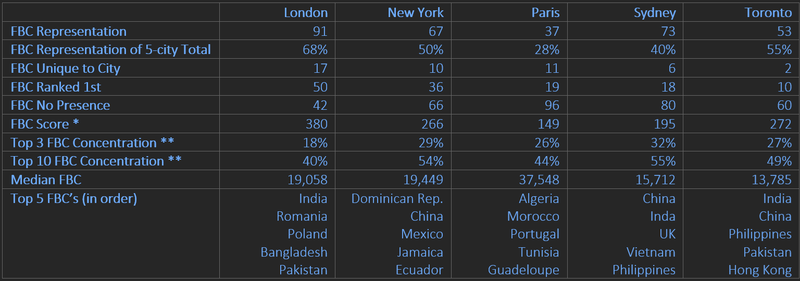
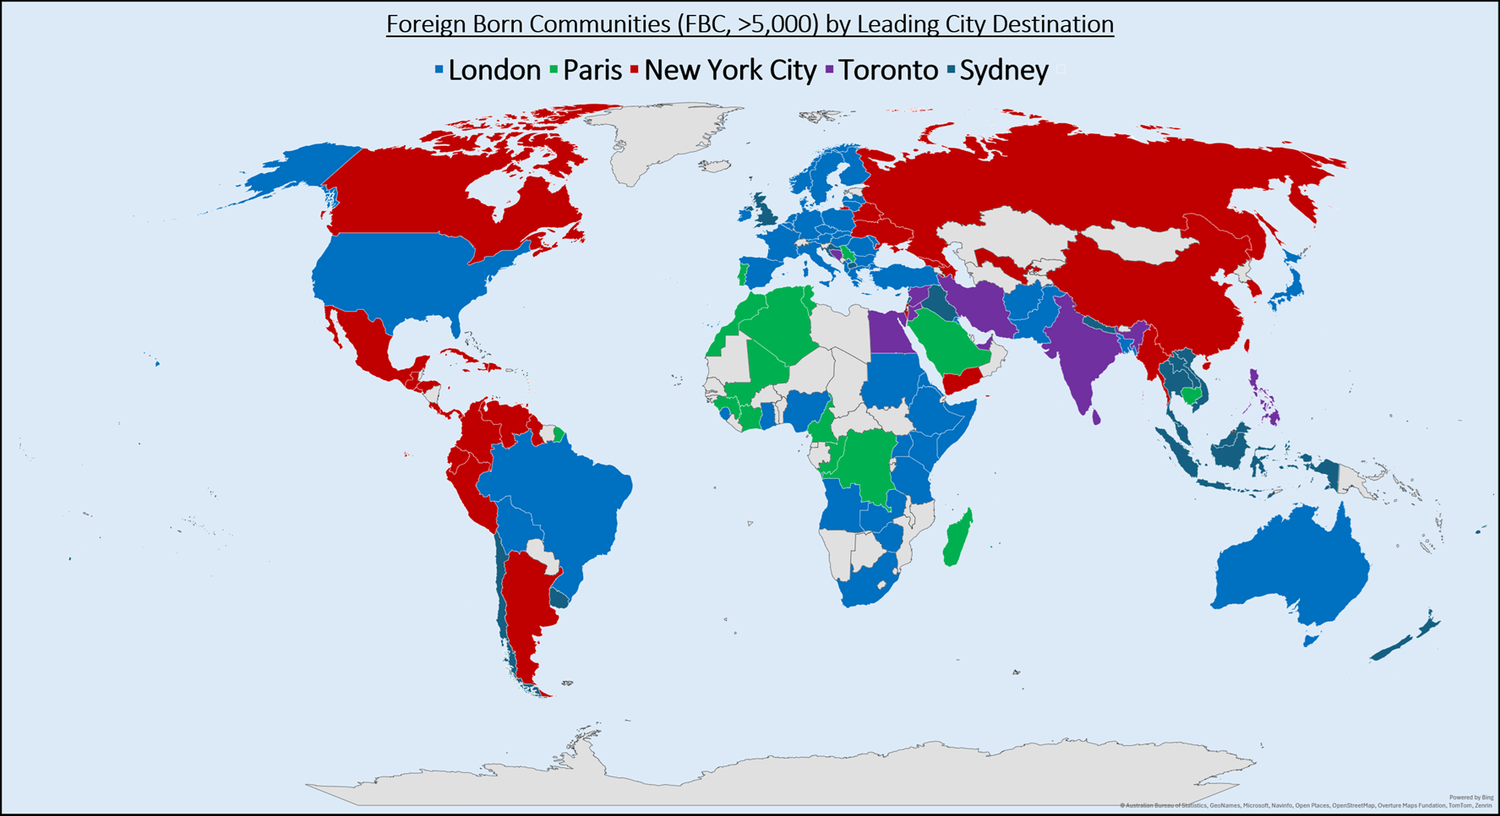
Taking Docere’s figures, I crunched some numbers using the London, Île-de-France (Greater Paris), Toronto CMA and Greater Sydney, and New York City (not metro) numbers from the ACS. Everything that follows is based only on Foreign Born Communities (FBC’s) >5,000 – across the five cities.

In total 133 countries are represented by at least one of these cities. A few interesting comments:
  • Paris is the least diverse of the five
  • Sydney has the highest concentration amongst the top 3 FBC’s, whilst London the lowest
  • Toronto surprisingly has the least number of FBC’s unique to that city
  • Across all five cities, China and India total 1.03mn and 1.00mn each. The Philippines is 3rd (416k), Dominican Rep. 4th (378k), and Algeria 5th (369k)
  • The are 11 FBC’s represented in all five cities: Brazil, China, Colombia, Germany, India, Italy, Pakistan, Poland, Russia, Turkey and Vietnam


* Simple ranked scoring system of 1st = 5 points, 2nd = 4, etc…)
** Against total foreign born population (inc. <5,000 FBC)
__________________
London Transport Thread updated: 2025-10-30 | London Stadium & Arena Thread updated: 2025-03-27
London General Update Thread updated: 2019-04-03 | High Speed 2 updated: 2025-10-06
Reply With Quote
     
     
  #160  
Old Posted Jul 10, 2026, 11:15 AM
nito nito is offline
Registered User
 
Join Date: Mar 2004
Posts: 2,960
__________________
London Transport Thread updated: 2025-10-30 | London Stadium & Arena Thread updated: 2025-03-27
London General Update Thread updated: 2019-04-03 | High Speed 2 updated: 2025-10-06
Reply With Quote
     
     
This discussion thread continues

Use the page links to the lower-right to go to the next page for additional posts
 
 
Reply

Go Back   SkyscraperPage Forum > Discussion Forums > City Discussions
Forum Jump


Forum Jump


All times are GMT. The time now is 5:07 PM.


Powered by vBulletin® Version 3.8.7
Copyright ©2000 - 2026, vBulletin Solutions, Inc.