Quote:
Originally Posted by sseguin

I hope this helps clarify how the numbers work:
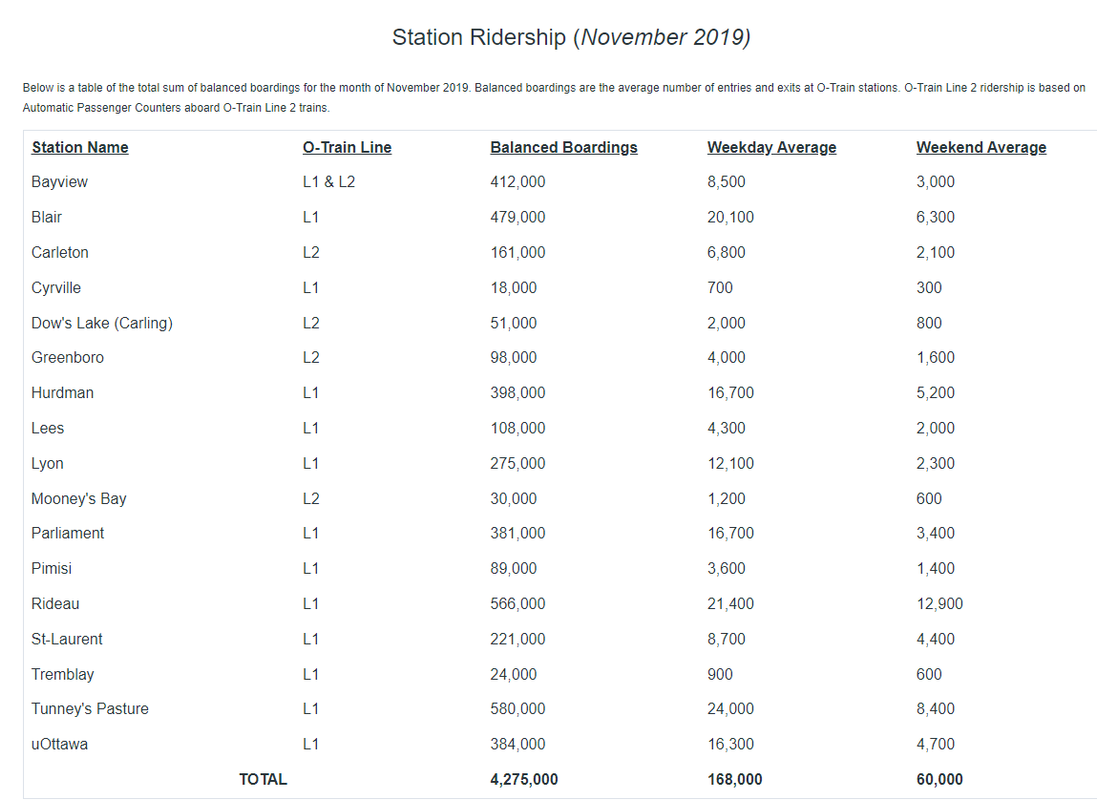
Below is a table of the total sum of balanced boardings for the month of November 2019. Balanced boardings are the average number of entries and exits at O-Train stations. O-Train Line 2 ridership is based on Automatic Passenger Counters aboard O-Train Line 2 trains.
Average ridership for weekdays and weekends is shown below, broken down by station, rounded to the closest 100.
Staff adjust ridership at all multimodal O-Train stations to account for transfers to O-Train Line 1 within fare-paid zones. It is important to note that the figures above for Tunney’s Pasture, Hurdman, Blair, and Greenboro Stations will also capture customers who are using the station to access bus service. For the ridership figures at Bayview Station, the total is a combination of balanced boardings for O-Train Line 1, as calculated with the fare paid zone adjustment factor, and the balanced boarding total for Line 2.
|
Thanks, Shane. I read that, too. It doesn’t clear up the numbers though.
For example, the average weekday boardings for Blair is 20,100, and on the week-end, the average is 6,300 boardings per day. If I assume 8 week-end days and 22 weekday days per month, then to get (near) the total monthly boardings, I just need to multiply the average boardings per day by the number of days:
For Blair: 20,100 per weekday X 22 days + 6,300 per week-end day X 8 days = 492,600
That is not too far off of the 479,000, when I account for rounding of the average numbers.
For Greenboro: 4,000 X 22 + 1,600 X 8 = 100,800 (compared to the given 98,000)
For uOttawa: 16,300 X 22 + 4,700 X 8 = 396,200 (compared to the given 384,000)
For Carleton: 6,800 X 22 + 2,100 X 8 = 166,400 (compared to the given 161,000)
For Hurdman: 16,700 X 22 + 5,200 X 8 = 409,000 (compared to the given 398,000)
In all cases, it looks as if the total boardings for the month is roughly 22 times the average weekday boardings, plus 8 times the average week-end boardings. This makes sense.
For Bayview: 8,500 per weekday X 22 + 3,000 per week-end X 8 = 211,000. The given total for that station is 412,000, which is about 200,000 total boardings higher than the calculated number of monthly boardings. This makes no sense.
I understand that Bayview is listed as the sum of the boardings for the L1 and L2 line, but that is immaterial for this calculation. The daily averages are also for combined boarding.
My only option is to say that there is a typo in the table.





 Prev
Prev




 Linear Mode
