Quote:
Originally Posted by misher

When we look at rent or price increases we use %. This is partially because our currency generally devalues, $100 a 100 years ago is a lot more significant a change than today. When prices went from 80k to 160k within a few years that was enormous to locals.
|
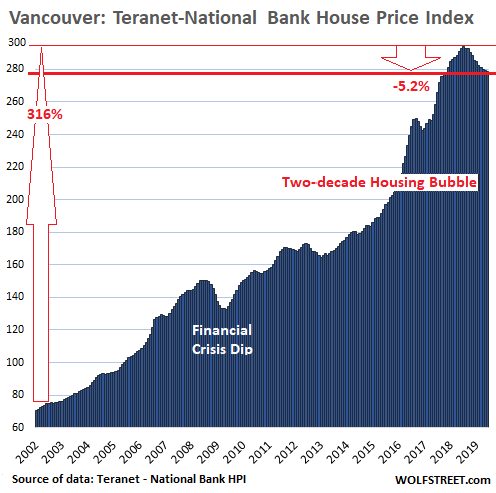
Here's another house price graph. It has nearly 20 years of data from the Teranet Index, which looks at price change of the same homes - so it takes out all the noise created by changing housing mix, more or less luxury condos, etc.
If you look at the first 10 years the angle of the graph is shallower than in the past 10 (even with the 5.2% drop in the past 2 years. That means the rate of price increase in the 2010s has been more than the rate of price increase in the 2000s.
[
source]
Here's another graph from RBC that compares average housing costs to income. The light blue line is condos. You can see that in 2019 a family needed to spend nearly 50% of median household income to buy a condo. For a detached home (the beige line at the top) you needed over 100% of income. Go back 10 years and they were a bit more affordable - you needed around 40% of median income to buy a condo, and around 90% for a detached home. In 1999 a household only needed 30% of income to buy a condo, and around 50% to buy a detached home. A decade before that in the early 1990s there was another spike in unaffordability, but a family still only needed 30% of income for a condo and around 40% to buy a detached home So have things got more or less affordable over the past 30 years? I would suggest they've got steadily less affordable until maybe two years ago, when prices stopped going up, and wages continued to grow a little.
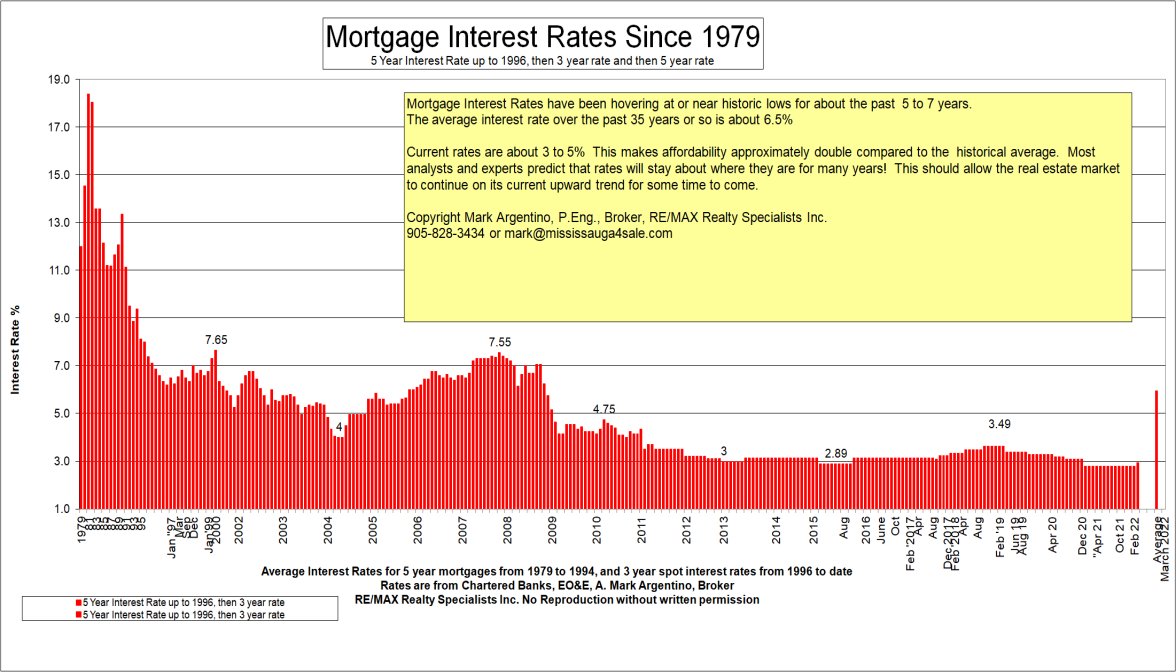
And I would argue that relates very closely to the cost of borrowing, more than any other factor, although obviously other factors can nudge the prices a little higher (or lower).

[
source]





 Prev
Prev





 Linear Mode
