HomeDiagramsDatabaseMapsForum About
     

Go Back   SkyscraperPage Forum > Regional Sections > Canada > Alberta & British Columbia > Vancouver > Business & the Economy


Reply

 
Thread Tools Display Modes
     
     
  #1561  
Old Posted May 1, 2020, 7:43 PM
GenWhy? GenWhy? is online now
Registered User
 
Join Date: Jun 2017
Posts: 4,826
Yeah April got moved to September and we'll see how that pans out. We moved from July launch to Sept to fall in-line but then everyone wants to be "first" to not lose out on all those delayed sales coming on-line. So it'll be competitive but for a market that is quite different and potentially smaller
Reply With Quote
     
     
  #1562  
Old Posted May 1, 2020, 7:51 PM
GenWhy? GenWhy? is online now
Registered User
 
Join Date: Jun 2017
Posts: 4,826
From the article:
"After the framework is created, application processing times for new social housing, below-market, and market rental housing will be reduced by 12 months to 18 months."

That's laughable. I'd exclude the market rental in that reduced processing time and maybe it would be believable.
Reply With Quote
     
     
  #1563  
Old Posted May 1, 2020, 8:02 PM
misher's Avatar
misher misher is offline
BANNED
 
Join Date: Jul 2018
Posts: 4,537
Quote:
Originally Posted by GenWhy? View Post
From the article:
"After the framework is created, application processing times for new social housing, below-market, and market rental housing will be reduced by 12 months to 18 months."

That's laughable. I'd exclude the market rental in that reduced processing time and maybe it would be believable.
Indeed I was very surprised to see them mention market rental in that and how big the reductions they are proposing are. I don't believe its doable.
Reply With Quote
     
     
  #1564  
Old Posted May 2, 2020, 4:19 AM
misher's Avatar
misher misher is offline
BANNED
 
Join Date: Jul 2018
Posts: 4,537
Have been saying for a while that high immigration not foreign buyers has driven Vancouver's price gains. You can really see it take off in BC in 2013 whereas money laundering and foreign buyers as a % did not change much since 2006:


https://twitter.com/CapEconCanada/status/1255548488089251840/photo/1
Reply With Quote
     
     
  #1565  
Old Posted May 2, 2020, 5:18 AM
Changing City's Avatar
Changing City Changing City is offline
Registered User
 
Join Date: Nov 2016
Posts: 8,252
Quote:
Originally Posted by misher View Post
Have been saying for a while that high immigration not foreign buyers has driven Vancouver's price gains. You can really see it take off in BC in 2013 whereas money laundering and foreign buyers as a % did not change much since 2006:
You can't see anything 'take off' with that graph. It doesn't show the number of immigrants, which are close to 40,000 to British Columbia every year for the past 20 years.
__________________
Contemporary Vancouver development blog, https://changingcitybook.wordpress.com/ Then and now Vancouver blog https://changingvancouver.wordpress.com/
Reply With Quote
     
     
  #1566  
Old Posted May 2, 2020, 2:42 PM
trofirhen trofirhen is offline
Registered User
 
Join Date: Oct 2008
Posts: 9,047
^^^which seems to beg the question ^^^^^^

If immigration levels have remained relatively stable, and as such the supply-demand curve is not warped out of proportion ...
What is causing the excessive and untenable price increases? The same syndrome exists in places like New Zealand.
Is it the prospect of an investment in real estate pauying out hugely, thereby creating a bandwagon effect?
I'd love to know, if anyone can offer a plausible theory.
Reply With Quote
     
     
  #1567  
Old Posted May 2, 2020, 4:03 PM
Changing City's Avatar
Changing City Changing City is offline
Registered User
 
Join Date: Nov 2016
Posts: 8,252
Quote:
Originally Posted by trofirhen View Post
If immigration levels have remained relatively stable, and as such the supply-demand curve is not warped out of proportion ...
What is causing the excessive and untenable price increases? The same syndrome exists in places like New Zealand.
Is it the prospect of an investment in real estate pauying out hugely, thereby creating a bandwagon effect?
I'd love to know, if anyone can offer a plausible theory.
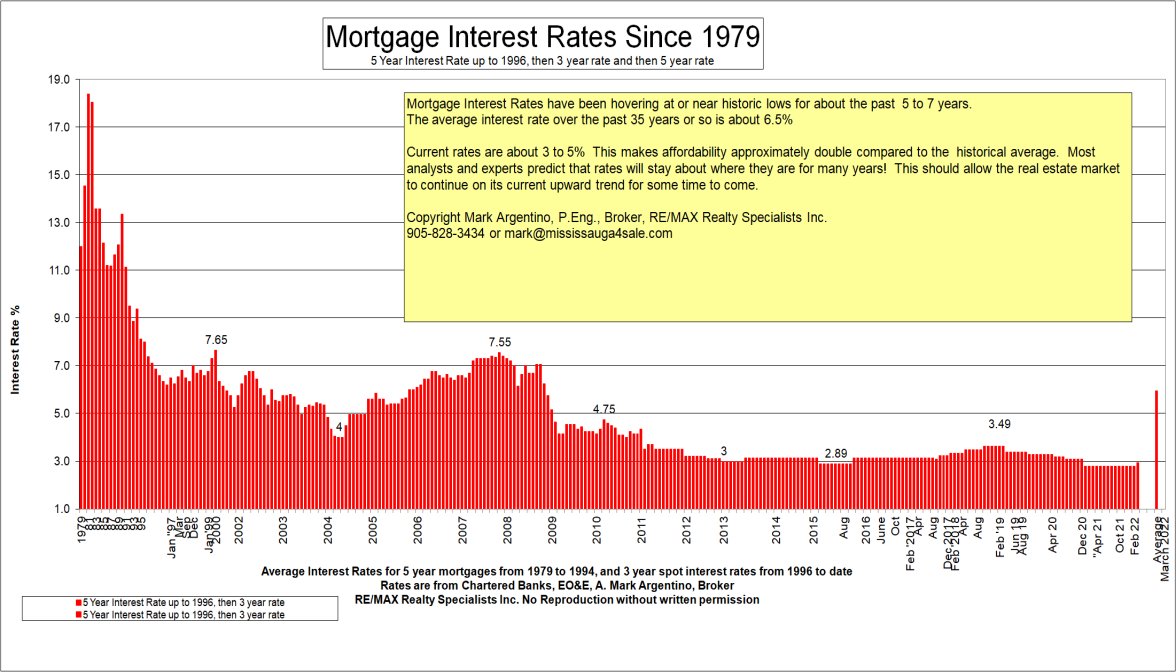
Certainly investment buyers of property has pushed prices up, but they wouldn't have been able to do that without cheap credit.

Low interest rates explain why both investors and buyers have been able to borrow more than previous generations of house buyers. Rising prices suggest acquiring property rather than other investments is an attractive option. The development of short term rentals in the past few years (like Airb&b) have made that option even more lucrative, and has meant housing has been removed from the normal rental or ownership options. The increase in 'alternate lenders' who apply less stringent requirements on the financial position of buyers hasn't helped either. There was a 'Fear of Missing Out' for the past several years - both of ownership, and investment opportunities.

If rates rise, credit becomes harder to obtain, and/or home values fall (which seems likely), we'll probably see a 'Fear of Getting In' and sales volumes will stay low. 'Nobody wants to catch a falling knife' is often used to explain the falling market. It will partly depend on how long Central Bank interest rates stay low. Banks aren't lowering their mortgage rates as much, and it's said to be harder to get alternate sources of financing now.


[http://www.mississauga4sale.com/rates-historic-mortgage-interest-1951.htm]
__________________
Contemporary Vancouver development blog, https://changingcitybook.wordpress.com/ Then and now Vancouver blog https://changingvancouver.wordpress.com/

Last edited by Changing City; May 2, 2020 at 4:31 PM.
Reply With Quote
     
     
  #1568  
Old Posted May 2, 2020, 4:18 PM
misher's Avatar
misher misher is offline
BANNED
 
Join Date: Jul 2018
Posts: 4,537
Quote:
Originally Posted by trofirhen View Post
If immigration levels have remained relatively stable, and as such the supply-demand curve is not warped out of proportion ...
What is causing the excessive and untenable price increases? The same syndrome exists in places like New Zealand.
Is it the prospect of an investment in real estate pauying out hugely, thereby creating a bandwagon effect?
I'd love to know, if anyone can offer a plausible theory.
Prices have been rising at a slower rate over the past 13 years. Before then they rose even faster for 25 years.

Likely the two biggest factors are a rising population and easier credit.

Easier credit=customers can afford more. But it also means they demand more. We have seen that people are generally dumb when it comes to credit. They will choose a 3 bedroom home over a 2 bedroom if they can afford it even if they only need 2 bedrooms. Just like they will choose to finance a bigger TV/couch, lease a used car at 7% and take a vacation using their credit card.

The problem is that all our credit systems assume people are going to be reasonable. But stats show us that they aren't.
Reply With Quote
     
     
  #1569  
Old Posted May 2, 2020, 4:29 PM
Changing City's Avatar
Changing City Changing City is offline
Registered User
 
Join Date: Nov 2016
Posts: 8,252
Quote:
Originally Posted by misher View Post
Prices have been rising at a slower rate over the past 13 years. Before then they rose even faster for 25 years.
Meanwhile, in the real world.


[source: Daily Hive from MLS]
__________________
Contemporary Vancouver development blog, https://changingcitybook.wordpress.com/ Then and now Vancouver blog https://changingvancouver.wordpress.com/
Reply With Quote
     
     
  #1570  
Old Posted May 2, 2020, 4:45 PM
misher's Avatar
misher misher is offline
BANNED
 
Join Date: Jul 2018
Posts: 4,537
Quote:
Originally Posted by Changing City View Post
Meanwhile, in the real world.


[source: Daily Hive from MLS]
Your just proving me right as you can see prices tripling from 80k to 240k then to 720k. They've more than doubled since but the rate of growth has definitely slowed.
Reply With Quote
     
     
  #1571  
Old Posted May 2, 2020, 5:02 PM
Changing City's Avatar
Changing City Changing City is offline
Registered User
 
Join Date: Nov 2016
Posts: 8,252
Quote:
Originally Posted by misher View Post
Your just proving me right as you can see prices tripling from 80k to 240k then to 720k. They've more than doubled since but the rate of growth has definitely slowed.
The rate of growth really doesn't mean anything, but to compare rate of change you have to use equal time periods.

The price is really what matters to buyers. If apartments are what you're looking at, then using your numbers, over 25 years to 2006 they rose by $140,000, or $5,600 a year. In the past 13 years they rose by $480,000 or $36,900 a year.
__________________
Contemporary Vancouver development blog, https://changingcitybook.wordpress.com/ Then and now Vancouver blog https://changingvancouver.wordpress.com/
Reply With Quote
     
     
  #1572  
Old Posted May 2, 2020, 5:34 PM
misher's Avatar
misher misher is offline
BANNED
 
Join Date: Jul 2018
Posts: 4,537
Quote:
Originally Posted by Changing City View Post
The rate of growth really doesn't mean anything, but to compare rate of change you have to use equal time periods.

The price is really what matters to buyers. If apartments are what you're looking at, then using your numbers, over 25 years to 2006 they rose by $140,000, or $5,600 a year. In the past 13 years they rose by $480,000 or $36,900 a year.
When we look at rent or price increases we use %. This is partially because our currency generally devalues, $100 a 100 years ago is a lot more significant a change than today. When prices went from 80k to 160k within a few years that was enormous to locals.
Reply With Quote
     
     
  #1573  
Old Posted May 2, 2020, 6:46 PM
Changing City's Avatar
Changing City Changing City is offline
Registered User
 
Join Date: Nov 2016
Posts: 8,252
Quote:
Originally Posted by misher View Post
When we look at rent or price increases we use %. This is partially because our currency generally devalues, $100 a 100 years ago is a lot more significant a change than today. When prices went from 80k to 160k within a few years that was enormous to locals.
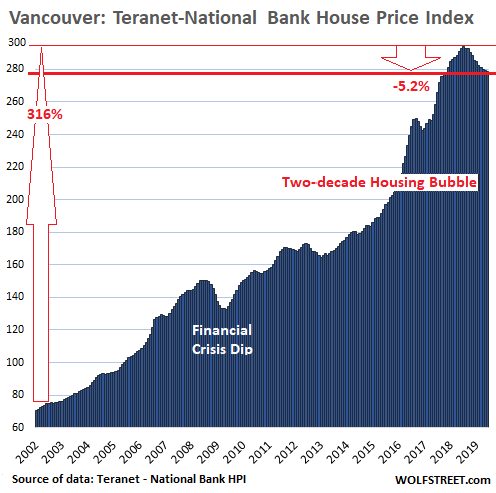
Here's another house price graph. It has nearly 20 years of data from the Teranet Index, which looks at price change of the same homes - so it takes out all the noise created by changing housing mix, more or less luxury condos, etc.

If you look at the first 10 years the angle of the graph is shallower than in the past 10 (even with the 5.2% drop in the past 2 years. That means the rate of price increase in the 2010s has been more than the rate of price increase in the 2000s.


[source]

Here's another graph from RBC that compares average housing costs to income. The light blue line is condos. You can see that in 2019 a family needed to spend nearly 50% of median household income to buy a condo. For a detached home (the beige line at the top) you needed over 100% of income. Go back 10 years and they were a bit more affordable - you needed around 40% of median income to buy a condo, and around 90% for a detached home. In 1999 a household only needed 30% of income to buy a condo, and around 50% to buy a detached home. A decade before that in the early 1990s there was another spike in unaffordability, but a family still only needed 30% of income for a condo and around 40% to buy a detached home So have things got more or less affordable over the past 30 years? I would suggest they've got steadily less affordable until maybe two years ago, when prices stopped going up, and wages continued to grow a little.

And I would argue that relates very closely to the cost of borrowing, more than any other factor, although obviously other factors can nudge the prices a little higher (or lower).


[source]
__________________
Contemporary Vancouver development blog, https://changingcitybook.wordpress.com/ Then and now Vancouver blog https://changingvancouver.wordpress.com/

Last edited by Changing City; May 2, 2020 at 7:38 PM. Reason: corrected % in text
Reply With Quote
     
     
  #1574  
Old Posted May 2, 2020, 9:34 PM
misher's Avatar
misher misher is offline
BANNED
 
Join Date: Jul 2018
Posts: 4,537
Quote:
Originally Posted by Changing City View Post
Here's another house price graph. It has nearly 20 years of data from the Teranet Index, which looks at price change of the same homes - so it takes out all the noise created by changing housing mix, more or less luxury condos, etc.

If you look at the first 10 years the angle of the graph is shallower than in the past 10 (even with the 5.2% drop in the past 2 years. That means the rate of price increase in the 2010s has been more than the rate of price increase in the 2000s.


[source]

Here's another graph from RBC that compares average housing costs to income. The light blue line is condos. You can see that in 2019 a family needed to spend nearly 50% of median household income to buy a condo. For a detached home (the beige line at the top) you needed over 100% of income. Go back 10 years and they were a bit more affordable - you needed around 40% of median income to buy a condo, and around 90% for a detached home. In 1999 a household only needed 30% of income to buy a condo, and around 50% to buy a detached home. A decade before that in the early 1990s there was another spike in unaffordability, but a family still only needed 30% of income for a condo and around 40% to buy a detached home So have things got more or less affordable over the past 30 years? I would suggest they've got steadily less affordable until maybe two years ago, when prices stopped going up, and wages continued to grow a little.

And I would argue that relates very closely to the cost of borrowing, more than any other factor, although obviously other factors can nudge the prices a little higher (or lower).


[source]
I agree with your points.
I suspect a lot of this does have to do with the cost of new builds though. 30 years ago we were building under a lot looser codes with a lot less safety and sustainable features. Now we're requiring landscaped rooftops and balconies among other features. These all cost more. Not to mention development fees, permit costs, taxes, etc. have all gone up. Its hard to compare what a house should cost to build 30 years ago to today given they are entirely different houses, and the prices for new builds today dictate the prices for old builds.

I don't like looking at incomes because they are a poor measure of buying power. For instance, people are living longer so they have more total money they make over their lifetimes but also bring the average income down as we now have a large segment making only a seniors pension. Or Vancouver has large swatches of places with little reported income so our median incomes are much lower than neighboring cities which is weird given that Vancouver is the business center.
Reply With Quote
     
     
  #1575  
Old Posted May 2, 2020, 9:56 PM
whatnext whatnext is offline
Registered User
 
Join Date: Feb 2009
Location: Vancouver
Posts: 27,833
Quote:
Originally Posted by Changing City View Post
Here's another house price graph. It has nearly 20 years of data from the Teranet Index, which looks at price change of the same homes - so it takes out all the noise created by changing housing mix, more or less luxury condos, etc.

If you look at the first 10 years the angle of the graph is shallower than in the past 10 (even with the 5.2% drop in the past 2 years. That means the rate of price increase in the 2010s has been more than the rate of price increase in the 2000s.


[source]

Here's another graph from RBC that compares average housing costs to income. The light blue line is condos. You can see that in 2019 a family needed to spend nearly 50% of median household income to buy a condo. For a detached home (the beige line at the top) you needed over 100% of income. Go back 10 years and they were a bit more affordable - you needed around 40% of median income to buy a condo, and around 90% for a detached home. In 1999 a household only needed 30% of income to buy a condo, and around 50% to buy a detached home. A decade before that in the early 1990s there was another spike in unaffordability, but a family still only needed 30% of income for a condo and around 40% to buy a detached home So have things got more or less affordable over the past 30 years? I would suggest they've got steadily less affordable until maybe two years ago, when prices stopped going up, and wages continued to grow a little.

And I would argue that relates very closely to the cost of borrowing, more than any other factor, although obviously other factors can nudge the prices a little higher (or lower).


[source]
And if you added the 1990s to that graph I suspect the change would be even more dramatic.
Reply With Quote
     
     
  #1576  
Old Posted May 2, 2020, 10:01 PM
Changing City's Avatar
Changing City Changing City is offline
Registered User
 
Join Date: Nov 2016
Posts: 8,252
Quote:
Originally Posted by misher View Post
I agree with your points.
I suspect a lot of this does have to do with the cost of new builds though. 30 years ago we were building under a lot looser codes with a lot less safety and sustainable features. Now we're requiring landscaped rooftops and balconies among other features. These all cost more. Not to mention development fees, permit costs, taxes, etc. have all gone up. Its hard to compare what a house should cost to build 30 years ago to today given they are entirely different houses, and the prices for new builds today dictate the prices for old builds.
But the house price index, and the affordability data are based on MLS sales. Those are resales, very very few new build homes are sold through the MLS initially. As new build homes represent a tiny proportion of all the homes sold, their cost shouldn't have much influence on MLS data.

Quote:
Originally Posted by misher View Post
I don't like looking at incomes because they are a poor measure of buying power. For instance, people are living longer so they have more total money they make over their lifetimes but also bring the average income down as we now have a large segment making only a seniors pension. Or Vancouver has large swatches of places with little reported income so our median incomes are much lower than neighboring cities which is weird given that Vancouver is the business center.
Income data would be for Greater Vancouver, not the city. The 2016 census showed over 60% of households who own their home had a mortgage, so their income would be an important factor.
__________________
Contemporary Vancouver development blog, https://changingcitybook.wordpress.com/ Then and now Vancouver blog https://changingvancouver.wordpress.com/
Reply With Quote
     
     
  #1577  
Old Posted May 4, 2020, 7:00 PM
whatnext whatnext is offline
Registered User
 
Join Date: Feb 2009
Location: Vancouver
Posts: 27,833
Metro Vancouver RE sales fall to the lowest level since 1982 (recession year):

Metro Vancouver home sales in April were the lowest total for the month since 1982, according to new data from the Real Estate Board of Greater Vancouver (REBGV).

They were also 63% lower than the 10-year sales average for the month - a direct result, said the board, of social distancing due to the COVID-19 pandemic...


https://biv.com/article/2020/05/covid-19-pushes-metro-vancouver-home-sales-lowest-level-1982-rebgv
Reply With Quote
     
     
  #1578  
Old Posted May 4, 2020, 7:50 PM
misher's Avatar
misher misher is offline
BANNED
 
Join Date: Jul 2018
Posts: 4,537
Quote:
Originally Posted by Changing City View Post
But the house price index, and the affordability data are based on MLS sales. Those are resales, very very few new build homes are sold through the MLS initially. As new build homes represent a tiny proportion of all the homes sold, their cost shouldn't have much influence on MLS data.


Income data would be for Greater Vancouver, not the city. The 2016 census showed over 60% of households who own their home had a mortgage, so their income would be an important factor.
To me new housing is like comparing what it costs to outfit a soldier/army between 1940 and today. There's more equipment, more electronics, its more advanced, there's more training, and it costs more to maintain that equipment. To keep costs from spiraling we need to find a new way of doing things.

Quote:
Outfitting a soldier for battle costs a hundred times more now than it did in World War II. It was $170 then, is about $17,500 now and could be an estimated $28,000 to $60,000 by the middle of the next decade.
https://www.seattlepi.com/national/article/Soldier-s-gear-costs-17-500-and-is-rising-1251404.php

To me the future is modular construction and a revised building code that focuses on efficiency, reliability, and long term maintenance costs. We can easily build 27 storey modular towers. Our building code has ignored affordability, reliability, and long term maintenance. Modules that can be built quickly in a factory mean that actual construction crews can be much smaller, water penetration into construction while its exposed is reduced, and several other benefits. We need to design housing that is built to last 100 years without major work (such as new membranes, pipes, boilers, windows), that can be quickly built in factories and assembled on site, and can fit on a truck. Honestly housing mass production has yet to take hold in Canada whereas in Asian nations its common. We're hand assembling Ferrari's rather than building constant Toyota's in factories.

https://www.dezeen.com/2019/07/02/clement-canopy-worlds-tallest-modular-tower-bouygues/

Last edited by misher; May 4, 2020 at 9:12 PM.
Reply With Quote
     
     
  #1579  
Old Posted May 7, 2020, 8:22 PM
misher's Avatar
misher misher is offline
BANNED
 
Join Date: Jul 2018
Posts: 4,537
Local BC market is heating up. No idea if this is a signal.

Quote:
In the last 14 days there have been 46 new listings in the West Kootenay and 24 of those have already sold. Some of those properties received multiple offers.

Statistics show prices have remained relatively stable through the COVID-19 pandemic, but that prices are still trending upward in the long term.
https://i.cbc.ca/1.4549244.1519411096!/f..._780/where-you-tax-dollar-goes-16-17.png
Reply With Quote
     
     
  #1580  
Old Posted May 7, 2020, 9:55 PM
Alex Mackinnon's Avatar
Alex Mackinnon Alex Mackinnon is offline
Can I has a tunnel?
 
Join Date: May 2008
Location: East Van
Posts: 2,203
Quote:
Originally Posted by misher View Post
Local BC market is heating up. No idea if this is a signal.


https://i.cbc.ca/1.4549244.1519411096!/f..._780/where-you-tax-dollar-goes-16-17.png
What were you trying to post there? something about Nelson? Your link doesn't seem connected.
__________________
"It's ok, I'm an engineer!" -Famous last words
Reply With Quote
     
     
This discussion thread continues

Use the page links to the lower-right to go to the next page for additional posts
 
 
Reply

Go Back   SkyscraperPage Forum > Regional Sections > Canada > Alberta & British Columbia > Vancouver > Business & the Economy
Forum Jump


Forum Jump


All times are GMT. The time now is 6:26 PM.


Powered by vBulletin® Version 3.8.7
Copyright ©2000 - 2026, vBulletin Solutions, Inc.