HomeDiagramsDatabaseMapsForum About
     

Go Back   SkyscraperPage Forum > Discussion Forums > City Discussions


Reply

 
Thread Tools Display Modes
     
     
  #1  
Old Posted Mar 26, 2020, 5:21 AM
azliam azliam is offline
Registered User
 
Join Date: Jul 2007
Location: Phoenix
Posts: 876
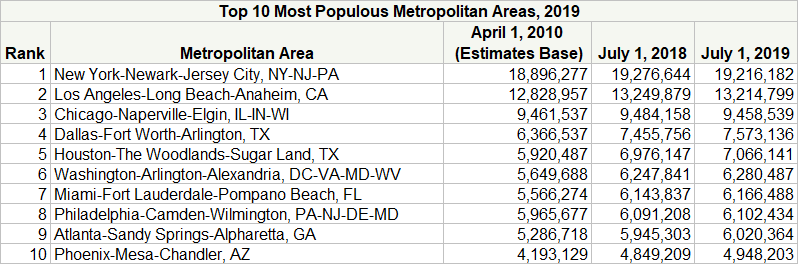
2019 Population Estimate U.S. Metropolitan Areas

Reply With Quote
     
     
  #2  
Old Posted Mar 26, 2020, 5:22 AM
azliam azliam is offline
Registered User
 
Join Date: Jul 2007
Location: Phoenix
Posts: 876
Reply With Quote
     
     
  #3  
Old Posted Mar 26, 2020, 1:38 PM
ABQalex ABQalex is online now
Registered User
 
Join Date: Dec 2019
Location: Albuquerque, NM
Posts: 1,584
Population estimates of the top 100 MSAs as of July 1, 2019:


1. New York-Newark-Jersey City, NY-NJ-PA, 19,216,182

2. Los Angeles-Long Beach-Anaheim, CA, 13,214,799

3. Chicago-Naperville-Elgin, IL-IN-WI, 9,458,539

4. Dallas-Fort Worth-Arlington, TX, 7,573,136

5. Houston-The Woodlands-Sugar Land, TX, 7,066,141

6. Washington-Arlington-Alexandria, DC-VA-MD-WV, 6,280,487

7. Miami-Fort Lauderdale-Pompano Beach, FL, 6,166,488

8. Philadelphia-Camden-Wilmington, PA-NJ-DE-MD, 6,102,434

9. Atlanta-Sandy Springs-Alpharetta, GA, 6,020,364

10. Phoenix-Mesa-Chandler, AZ, 4,948,203

11. Boston-Cambridge-Newton, MA-NH, 4,873,019

12. San Francisco-Oakland-Berkeley, CA, 4,731,803

13. Riverside-San Bernardino-Ontario, CA, 4,650,631

14. Detroit-Warren-Dearborn, MI, 4,319,629

15. Seattle-Tacoma-Bellevue, WA, 3,979,845

16. Minneapolis-St. Paul-Bloomington, MN-WI, 3,640,043

17. San Diego-Chula Vista-Carlsbad, CA, 3,338,330

18. Tampa-St. Petersburg-Clearwater, FL, 3,194,831

19. Denver-Aurora-Lakewood, CO, 2,967,239

20. St. Louis, MO-IL, 2,803,228

21. Baltimore-Columbia-Towson, MD, 2,800,053

22. Charlotte-Concord-Gastonia, NC-SC, 2,636,883

23. Orlando-Kissimmee-Sanford, FL, 2,608,147

24. San Antonio-New Braunfels, TX, 2,550,960

25. Portland-Vancouver-Hillsboro, OR-WA, 2,492,412

26. Sacramento-Roseville-Folsom, CA, 2,363,730

27. Pittsburgh, PA, 2,317,600

28. Las Vegas-Henderson-Paradise, NV, 2,266,715

29. Austin-Round Rock-Georgetown, TX, 2,227,083

30. Cincinnati, OH-KY-IN, 2,221,208

31. Kansas City, MO-KS, 2,157,990

32. Columbus, OH, 2,122,271

33. Indianapolis-Carmel-Anderson, IN, 2,074,537

34. Cleveland-Elyria, OH, 2,048,449

35. San Jose-Sunnyvale-Santa Clara, CA, 1,990,660

36. Nashville-Davidson--Murfreesboro--Franklin, TN, 1,934,317

37. Virginia Beach-Norfolk-Newport News, VA-NC, 1,768,901

38. Providence-Warwick, RI-MA, 1,624,578

39. Milwaukee-Waukesha, WI, 1,575,179

40. Jacksonville, FL, 1,559,514

41. Oklahoma City, OK, 1,408,950

42. Raleigh-Cary, NC, 1,390,785

43. Memphis, TN-MS-AR, 1,346,045

44. Richmond, VA, 1,291,900

45. New Orleans-Metairie, LA, 1,270,530

46. Louisville/Jefferson County, KY-IN, 1,265,108

47. Salt Lake City, UT, 1,232,696

48. Hartford-East Hartford-Middletown, CT, 1,204,877

49. Buffalo-Cheektowaga, NY, 1,127,983

50. Birmingham-Hoover, AL, 1,090,435

51. Grand Rapids-Kentwood, MI, 1,077,370

52. Rochester, NY, 1,069,644

53. Tucson, AZ, 1,047,279

54. Fresno, CA, 999,101

55. Tulsa, OK, 998,626

56. Urban Honolulu, HI, 974,563

57. Omaha-Council Bluffs, NE-IA, 949,442

58. Worcester, MA-CT, 947,404

59. Bridgeport-Stamford-Norwalk, CT, 943,332

60. Greenville-Anderson, SC, 920,477

61. Albuquerque, NM, 918,018

62. Bakersfield, CA, 900,202

63. Albany-Schenectady-Troy, NY, 880,381

64. Knoxville, TN, 869,046

65. McAllen-Edinburg-Mission, TX, 868,707

66. Baton Rouge, LA, 854,884

67. New Haven-Milford, CT, 854,757

68. Oxnard-Thousand Oaks-Ventura, CA, 846,006

69. El Paso, TX, 844,124

70. Allentown-Bethlehem-Easton, PA-NJ, 844,052

71. Columbia, SC, 838,433

72. North Port-Sarasota-Bradenton, FL, 836,995

73. Dayton-Kettering, OH, 807,611

74. Charleston-North Charleston, SC, 802,122

75. Greensboro-High Point, NC, 771,851

76. Cape Coral-Fort Myers, FL, 770,577

77. Stockton, CA, 762,148

78. Boise City, ID, 749,202

79. Colorado Springs, CO, 745,791

80. Little Rock-North Little Rock-Conway, AR, 742,384

81. Lakeland-Winter Haven, FL, 724,777

82. Akron, OH, 703,479

83. Des Moines-West Des Moines, IA, 699,292

84. Springfield, MA, 697,382

85. Ogden-Clearfield, UT, 683,864

86. Poughkeepsie-Newburgh-Middletown, NY, 679,158

87. Winston-Salem, NC, 676,008

88. Deltona-Daytona Beach-Ormond Beach, FL, 668,365

89. Madison, WI, 664,865

90. Syracuse, NY, 648,593

91. Provo-Orem, UT, 648,252

92. Durham-Chapel Hill, NC, 644,367

93. Toledo, OH, 641,816

94. Wichita, KS, 640,218

95. Augusta-Richmond County, GA-SC, 608,980

96. Palm Bay-Melbourne-Titusville, FL, 601,942

97. Jackson, MS, 594,806

98. Harrisburg-Carlisle, PA, 577,941

99. Spokane-Spokane Valley, WA, 568,521

100. Chattanooga, TN-GA, 565,194

Reply With Quote
     
     
  #4  
Old Posted Mar 26, 2020, 1:39 PM
ABQalex ABQalex is online now
Registered User
 
Join Date: Dec 2019
Location: Albuquerque, NM
Posts: 1,584
Population estimates of the 101st-200th largest MSAs as of July 1, 2019:


101. Scranton--Wilkes-Barre, PA, 553,885

102. Modesto, CA, 550,660

103. Lansing-East Lansing, MI, 550,391

104. Lancaster, PA, 545,724

105. Portland-South Portland, ME, 538,500

106. Youngstown-Warren-Boardman, OH-PA, 536,081

107. Fayetteville-Springdale-Rogers, AR, 534,904

108. Fayetteville, NC, 526,719

109. Lexington-Fayette, KY, 517,056

110. Pensacola-Ferry Pass-Brent, FL, 502,629

111. Myrtle Beach-Conway-North Myrtle Beach, SC-NC, 496,901

112. Santa Rosa-Petaluma, CA, 494,336

113. Port St. Lucie, FL, 489,297

114. Lafayette, LA, 489,207

115. Reno, NV, 475,642

116. Huntsville, AL, 471,824

117. Springfield, MO, 470,300

118. Visalia, CA, 466,195

119. Asheville, NC, 462,680

120. Killeen-Temple, TX, 460,303

121. York-Hanover, PA, 449,058

122. Vallejo, CA, 447,643

123. Santa Maria-Santa Barbara, CA, 446,499

124. Salinas, CA, 434,061

125. Salem, OR, 433,903

126. Mobile, AL, 429,536

127. Corpus Christi, TX, 429,024

128. Brownsville-Harlingen, TX, 423,163

129. Reading, PA, 421,164

130. Gulfport-Biloxi, MS, 417,665

131. Manchester-Nashua, NH, 417,025

132. Salisbury, MD-DE, 415,726

133. Fort Wayne, IN, 413,263

134. Flint, MI, 405,813

135. Peoria, IL, 400,561

136. Canton-Massillon, OH, 397,520

137. Anchorage, AK, 396,317

138. Shreveport-Bossier City, LA, 394,706

139. Savannah, GA, 393,353

140. Beaumont-Port Arthur, TX, 392,563

141. Tallahassee, FL, 387,227

142. Naples-Marco Island, FL, 384,902

143. Eugene-Springfield, OR, 382,067

144. Davenport-Moline-Rock Island, IA-IL, 379,172

145. Montgomery, AL, 373,290

146. Hickory-Lenoir-Morganton, NC, 369,711

147. Ann Arbor, MI, 367,601

148. Trenton-Princeton, NJ, 367,430

149. Ocala, FL, 365,579

150. Fort Collins, CO, 356,899

151. Huntington-Ashland, WV-KY-OH, 355,873

152. Lincoln, NE, 336,374

153. Rockford, IL, 336,116

154. Gainesville, FL, 329,128

155. Boulder, CO, 326,196

156. Greeley, CO, 324,492

157. South Bend-Mishawaka, IN-MI, 323,613

158. Green Bay, WI, 322,906

159. Lubbock, TX, 322,257

160. Columbus, GA-AL, 321,048

161. Spartanburg, SC, 319,785

162. Evansville, IN-KY, 315,086

163. Roanoke, VA, 313,222

164. Clarksville, TN-KY, 307,820

165. Kingsport-Bristol, TN-VA, 307,202

166. Kennewick-Richland, WA, 299,612

167. Wilmington, NC, 297,533

168. Olympia-Lacey-Tumwater, WA, 290,536

169. Utica-Rome, NY, 289,990

170. Duluth, MN-WI, 288,732

171. Hagerstown-Martinsburg, MD-WV, 288,104

172. Longview, TX, 286,657

173. Crestview-Fort Walton Beach-Destin, FL, 284,809

174. San Luis Obispo-Paso Robles, CA, 283,111

175. Merced, CA, 277,680

176. Laredo, TX, 276,652

177. Waco, TX, 273,920

178. Santa Cruz-Watsonville, CA, 273,213

179. Cedar Rapids, IA, 273,032

180. Bremerton-Silverdale-Port Orchard, WA, 271,473

181. Erie, PA, 269,728

182. Sioux Falls, SD, 268,232

183. Norwich-New London, CT, 265,206

184. Kalamazoo-Portage, MI, 265,066

185. Amarillo, TX, 265,053

186. College Station-Bryan, TX, 264,728

187. Atlantic City-Hammonton, NJ, 263,670

188. Lynchburg, VA, 263,566

189. Charleston, WV, 257,074

190. Tuscaloosa, AL, 252,047

191. Yakima, WA, 250,873

192. Fort Smith, AR-OK, 250,368

193. Fargo, ND-MN, 246,145

194. Binghamton, NY, 238,691

195. Appleton, WI, 237,974

196. Prescott Valley-Prescott, AZ, 235,099

197. Lafayette-West Lafayette, IN, 233,002

198. Tyler, TX, 232,751

199. Topeka, KS, 231,969

200. Macon-Bibb County, GA, 229,996
Reply With Quote
     
     
  #5  
Old Posted Mar 26, 2020, 1:40 PM
ABQalex ABQalex is online now
Registered User
 
Join Date: Dec 2019
Location: Albuquerque, NM
Posts: 1,584
Population estimates of the 201st-300th largest MSAs as of July 1, 2019:


201. Bellingham, WA, 229,247

202. Champaign-Urbana, IL, 226,033

203. Daphne-Fairhope-Foley, AL, 223,234

204. Hilton Head Island-Bluffton, SC, 222,195

205. Rochester, MN, 221,921

206. Medford, OR, 220,944

207. Burlington-South Burlington, VT, 220,411

208. Chico, CA, 219,186

209. Charlottesville, VA, 218,615

210. Las Cruces, NM, 218,195

211. Yuma, AZ, 213,787

212. Athens-Clarke County, GA, 213,750

213. Barnstable Town, MA, 212,990

214. Lake Havasu City-Kingman, AZ, 212,181

215. Lake Charles, LA, 210,409

216. Columbia, MO, 208,173

217. Houma-Thibodaux, LA, 208,075

218. Springfield, IL, 206,868

219. Elkhart-Goshen, IN, 206,341

220. Florence, SC, 204,911

221. Gainesville, GA, 204,441

222. Johnson City, TN, 203,649

223. St. Cloud, MN, 201,964

224. Monroe, LA, 200,261

225. Jacksonville, NC, 197,938

226. Bend, OR, 197,692

227. Racine, WI, 196,311

228. Saginaw, MI, 190,539

229. Punta Gorda, FL, 188,910

230. Terre Haute, IN, 186,367

231. Warner Robins, GA, 185,409

232. Midland, TX, 182,603

233. Billings, MT, 181,667

234. El Centro, CA, 181,215

235. Dover, DE, 180,786

236. Greenville, NC, 180,742

237. Redding, CA, 180,080

238. Joplin, MO, 179,564

239. Bowling Green, KY, 179,240

240. Jackson, TN, 178,644

241. Kingston, NY, 177,573

242. St. George, UT, 177,556

243. Yuba City, CA, 175,639

244. Panama City, FL, 174,705

245. Muskegon, MI, 173,566

246. Iowa City, IA, 173,105

247. Abilene, TX, 172,060

248. Oshkosh-Neenah, WI, 171,907

249. Bloomington, IL, 171,517

250. East Stroudsburg, PA, 170,271

251. Burlington, NC, 169,509

252. Eau Claire, WI, 169,304

253. Bloomington, IN, 169,230

254. Hattiesburg, MS, 168,849

255. Waterloo-Cedar Falls, IA, 168,522

256. Pueblo, CO, 168,424

257. Blacksburg-Christiansburg, VA, 167,531

258. Kahului-Wailuku-Lahaina, HI, 167,417

259. Odessa, TX, 166,223

260. Coeur d'Alene, ID, 165,697

261. Auburn-Opelika, AL, 164,542

262. Janesville-Beloit, WI, 163,354

263. Wausau-Weston, WI, 163,285

264. State College, PA, 162,385

265. Sebastian-Vero Beach, FL, 159,923

266. Jackson, MI, 158,510

267. Madera, CA, 157,327

268. Chambersburg-Waynesboro, PA, 155,027

269. Grand Junction, CO, 154,210

270. Elizabethtown-Fort Knox, KY, 153,928

271. Niles, MI, 153,401

272. Hanford-Corcoran, CA, 152,940

273. Decatur, AL, 152,603

274. Bangor, ME, 152,148

275. Alexandria, LA, 152,037

276. Idaho Falls, ID, 151,530

277. Wichita Falls, TX, 151,254

278. Jefferson City, MO, 151,235

279. Monroe, MI, 150,500

280. Santa Fe, NM, 150,358

281. Homosassa Springs, FL, 149,657

282. Vineland-Bridgeton, NJ, 149,527

283. Dothan, AL, 149,358

284. Texarkana, TX-AR, 148,761

285. Florence-Muscle Shoals, AL, 147,970

286. Valdosta, GA, 147,292

287. Albany, GA, 146,726

288. Rocky Mount, NC, 145,770

289. Dalton, GA, 144,724

290. Sioux City, IA-NE-SD, 144,701

291. Flagstaff, AZ, 143,476

292. Morristown, TN, 142,749

293. Logan, UT-ID, 142,165

294. Rapid City, SD, 142,107

295. Lebanon, PA, 141,793

296. Winchester, VA-WV, 140,566

297. Sumter, SC, 140,466

298. Morgantown, WV, 139,044

299. Wheeling, WV-OH, 138,948

300. Napa, CA, 137,744
Reply With Quote
     
     
  #6  
Old Posted Mar 26, 2020, 1:40 PM
ABQalex ABQalex is online now
Registered User
 
Join Date: Dec 2019
Location: Albuquerque, NM
Posts: 1,584
Population estimates of the 301st-384th largest MSAs as of July 1, 2019:


301. La Crosse-Onalaska, WI-MN, 136,616

302. Sherman-Denison, TX, 136,212

303. Carbondale-Marion, IL, 135,764

304. Harrisonburg, VA, 134,964

305. Hammond, LA, 134,758

306. Battle Creek, MI, 134,159

307. Springfield, OH, 134,083

308. Jonesboro, AR, 133,860

309. The Villages, FL, 132,420

310. Manhattan, KS, 130,285

311. Johnstown, PA, 130,192

312. Albany-Lebanon, OR, 129,749

313. Mount Vernon-Anacortes, WA, 129,205

314. Bismarck, ND, 128,949

315. Lawton, OK, 126,415

316. Sierra Vista-Douglas, AZ, 125,922

317. St. Joseph, MO-KS, 125,223

318. Glens Falls, NY, 125,148

319. Pittsfield, MA, 124,944

320. Cleveland, TN, 124,942

321. New Bern, NC, 124,284

322. Farmington, NM, 123,958

323. Ames, IA, 123,351

324. Goldsboro, NC, 123,131

325. Staunton, VA, 123,120

326. Lawrence, KS, 122,259

327. San Angelo, TX, 122,027

328. Altoona, PA, 121,829

329. Mansfield, OH, 121,154

330. Wenatchee, WA, 120,629

331. Missoula, MT, 119,600

332. Owensboro, KY, 119,440

333. Brunswick, GA, 118,779

334. Weirton-Steubenville, WV-OH, 116,074

335. Beckley, WV, 115,767

336. Sheboygan, WI, 115,340

337. Muncie, IN, 114,135

338. Anniston-Oxford, AL, 113,605

339. California-Lexington Park, MD, 113,510

340. Williamsport, PA, 113,299

341. Twin Falls, ID, 111,290

342. Longview, WA, 110,593

343. Michigan City-La Porte, IN, 109,888

344. Kankakee, IL, 109,862

345. Watertown-Fort Drum, NY, 109,834

346. Lewiston-Auburn, ME, 108,277

347. Sebring-Avon Park, FL, 106,221

348. Decatur, IL, 104,009

349. Fond du Lac, WI, 103,403

350. Bay City, MI, 103,126

351. Gettysburg, PA, 103,009

352. Lima, OH, 102,351

353. Gadsden, AL, 102,268

354. Ithaca, NY, 102,180

355. Mankato, MN, 101,927

356. Grand Forks, ND-MN, 100,815

357. Victoria, TX, 99,742

358. Cheyenne, WY, 99,500

359. Hot Springs, AR, 99,386

360. Rome, GA, 98,498

361. Dubuque, IA, 97,311

362. Cumberland, MD-WV, 97,284

363. Fairbanks, AK, 96,849

364. Cape Girardeau, MO-IL, 96,765

365. Pocatello, ID, 95,489

366. Corvallis, OR, 93,053

367. Ocean City, NJ, 92,039

368. Parkersburg-Vienna, WV, 89,339

369. Pine Bluff, AR, 87,804

370. Grants Pass, OR, 87,487

371. Columbus, IN, 83,779

372. Elmira, NY, 83,456

373. Bloomsburg-Berwick, PA, 83,194

374. Midland, MI, 83,156

375. Kokomo, IN, 82,544

376. Great Falls, MT, 81,366

377. Hinesville, GA, 80,994

378. Casper, WY, 79,858

379. Danville, IL, 75,758

380. Grand Island, NE, 75,553

381. Lewiston, ID-WA, 62,990

382. Enid, OK, 61,056

383. Walla Walla, WA, 60,760

384. Carson City, NV, 55,916
Reply With Quote
     
     
  #7  
Old Posted Mar 26, 2020, 2:58 PM
pj3000's Avatar
pj3000 pj3000 is online now
Registered User
 
Join Date: Jun 2005
Location: Pittsburgh & Miami
Posts: 7,957
MSA is a stubborn relic of the past.

It's long past time to retire it as a metric of statistical significance.
Reply With Quote
     
     
  #8  
Old Posted Mar 26, 2020, 3:02 PM
Acajack's Avatar
Acajack Acajack is offline
Gros Méchant Loup
 
Join Date: Aug 2006
Location: SSP Graveyard
Posts: 72,949
I guess I am out of touch but I am a bit shocked to see the top 3 metros declining in population. Well, maybe not Chicago, but NYC and LA???
Reply With Quote
     
     
  #9  
Old Posted Mar 26, 2020, 3:38 PM
iheartthed iheartthed is online now
Registered User
 
Join Date: Oct 2009
Location: New York
Posts: 12,181
Quote:
Originally Posted by Acajack View Post
I guess I am out of touch but I am a bit shocked to see the top 3 metros declining in population. Well, maybe not Chicago, but NYC and LA???
For NYC, it's nuanced. The core areas have more people than ever, but the outer areas are losing population. If it weren't for NYC and the inner counties in New Jersey, the regional population losses would be quite massive.
Reply With Quote
     
     
  #10  
Old Posted Mar 26, 2020, 3:44 PM
Obadno Obadno is offline
BANNED
 
Join Date: Jan 2010
Posts: 6,902
Quote:
Originally Posted by Acajack View Post
I guess I am out of touch but I am a bit shocked to see the top 3 metros declining in population. Well, maybe not Chicago, but NYC and LA???
In the last 4 years or so the prices in these cities have really increased and its pushing people out.
Reply With Quote
     
     
  #11  
Old Posted Mar 26, 2020, 3:46 PM
Obadno Obadno is offline
BANNED
 
Join Date: Jan 2010
Posts: 6,902
Quote:
Originally Posted by pj3000 View Post
MSA is a stubborn relic of the past.

It's long past time to retire it as a metric of statistical significance.
For what? CSA is an even crazier based on daily comutes between MSA's

MSA's themselves are based on counties which I think is absurd especially out west with our massive counties

You have Podunk towns like Barstow, Blythe, Brawly and Calexico included in the costal city MSA's in So cal.

You have truck stop towns like Gila Bend over an hour from Phoenix in its MSA' because it happens to be on the far edge of a massive county
Reply With Quote
     
     
  #12  
Old Posted Mar 26, 2020, 3:54 PM
Acajack's Avatar
Acajack Acajack is offline
Gros Méchant Loup
 
Join Date: Aug 2006
Location: SSP Graveyard
Posts: 72,949
Quote:
Originally Posted by iheartthed View Post
For NYC, it's nuanced. The core areas have more people than ever, but the outer areas are losing population. If it weren't for NYC and the inner counties in New Jersey, the regional population losses would be quite massive.
I would surmise that the biggest losses are probably in the in-between zones or secondary ring of suburbs. Areas mostly developed from the 50s to the 70s.

The outermost ring (usually exurban in character) seems to be growing in most any urban area anywhere.

And of course as you say the innermost areas have undergone a renaissance.
Reply With Quote
     
     
  #13  
Old Posted Mar 26, 2020, 3:55 PM
BG918's Avatar
BG918 BG918 is offline
Registered User
 
Join Date: Nov 2002
Posts: 3,554
Quote:
Originally Posted by Obadno View Post
You have truck stop towns like Gila Bend over an hour from Phoenix in its MSA' because it happens to be on the far edge of a massive county
It's definitely more pronounced in the western states due to the large county size. In Colorado, even within the Denver MSA, you have huge counties that have urban portions adjacent to Denver but also little towns way out on the eastern Plains next to the Wyoming and Nebraska state lines (like Weld County). These towns are a world apart from Denver but are included in the MSA.
Reply With Quote
     
     
  #14  
Old Posted Mar 26, 2020, 4:05 PM
iheartthed iheartthed is online now
Registered User
 
Join Date: Oct 2009
Location: New York
Posts: 12,181
Quote:
Originally Posted by Acajack View Post
I would surmise that the biggest losses are probably in the in-between zones or secondary ring of suburbs. Areas mostly developed from the 50s to the 70s.

The outermost ring (usually exurban in character) seems to be growing in most any urban area anywhere.

And of course as you say the innermost areas have undergone a renaissance.
I think it's mixed. On the New Jersey side, the inner ring is doing well.* On Long Island, Suffolk County is more exurban mixed with semi-rural, and it's not doing that well. North of NYC, Westchester County is a mesh of inner-ring suburban and ex-urban, and it's still showing healthy growth.

*Except for Monmouth County. Not sure what's going on there. Maybe the decline is Hurricane Sandy related?
Reply With Quote
     
     
  #15  
Old Posted Mar 26, 2020, 4:29 PM
Obadno Obadno is offline
BANNED
 
Join Date: Jan 2010
Posts: 6,902
Quote:
Originally Posted by iheartthed View Post
I think it's mixed. On the New Jersey side, the inner ring is doing well.* On Long Island, Suffolk County is more exurban mixed with semi-rural, and it's not doing that well. North of NYC, Westchester County is a mesh of inner-ring suburban and ex-urban, and it's still showing healthy growth.

*Except for Monmouth County. Not sure what's going on there. Maybe the decline is Hurricane Sandy related?
Its also important to keep in mind density.

In exurban environments it does not take much for them to be growing at a steady clip in the statistics. And you can see cities that are shrinking but you wouldn't know it based on the cranes.

For example Buckeye last year was the fastest growing town. Bunch of articles about it It added like 5k residents or something. Its a tiny farm community on the outermost fringe of the phoenix metro. IF you go there its mostly nothing but cotton, but over the last few years a few fields have been turned into classic master-planned communities. They got a new strip mall and a couple of fast food joints.

Realistically it isnt a lot of growth but relative to a few years ago its massive.
Reply With Quote
     
     
  #16  
Old Posted Mar 26, 2020, 4:37 PM
Acajack's Avatar
Acajack Acajack is offline
Gros Méchant Loup
 
Join Date: Aug 2006
Location: SSP Graveyard
Posts: 72,949
Quote:
Originally Posted by iheartthed View Post
I think it's mixed. On the New Jersey side, the inner ring is doing well.* On Long Island, Suffolk County is more exurban mixed with semi-rural, and it's not doing that well. North of NYC, Westchester County is a mesh of inner-ring suburban and ex-urban, and it's still showing healthy growth.

*Except for Monmouth County. Not sure what's going on there. Maybe the decline is Hurricane Sandy related?
My observation is that in most metros areas that look like this:

https://www.google.ca/maps/place/Honeyda...57dd4713e!8m2!3d43.6294549!4d-79.5489727

Don't seem to do well unless there is a considerable influx of immigrants. In Canada where large immigrant waves only go to a small number of cities, areas such as these would be in major decline if not for them. These post-war areas tend to have decent locations, reasonably spacious houses and affordable prices (relative to the rest of the metro).

In the U.S. where the number of large and largish metros competing for immigrants is much higher, these areas tend to struggle more.

(Note that this picture is taken from Toronto, which has few areas that are truly struggling. The crappiness you see here is transitional. Even today it might be that that area doesn't look like that anymore.)
Reply With Quote
     
     
  #17  
Old Posted Mar 26, 2020, 4:54 PM
sopas ej's Avatar
sopas ej sopas ej is offline
Registered User
 
Join Date: Jul 2007
Location: South Pasadena, California
Posts: 8,202
Quote:
Originally Posted by Obadno View Post
For what? CSA is an even crazier based on daily comutes between MSA's

MSA's themselves are based on counties which I think is absurd especially out west with our massive counties

You have Podunk towns like Barstow, Blythe, Brawly and Calexico included in the costal city MSA's in So cal.

Not true. LA's MSA is LA and Orange Counties (Los Angeles-Long Beach-Anaheim MSA). Barstow and Blythe would be part of the Riverside-San Bernardino-Ontario MSA (the Inland Empire), which is San Bernardino and Riverside Counties, which aren't coastal. Same with Brawley and Calexico, which are both in Imperial County, which is its own MSA (El Centro MSA). San Diego County, which is coastal, is its own MSA (San Diego-Chula Vista-Carlsbad MSA). San Diego's CSA is San Diego-Tijuana, I believe, and doesn't include Imperial County.

Now if you're talking about LA's CSA, then yes, it would include all of LA, Orange, Ventura, San Bernardino and Riverside Counties, and would lump in those podunk little towns with coastal areas.
Reply With Quote
     
     
  #18  
Old Posted Mar 26, 2020, 5:08 PM
JManc's Avatar
JManc JManc is offline
Administrator
 
Join Date: Feb 2003
Location: Houston
Posts: 23,138
Quote:
Originally Posted by Obadno View Post
For what? CSA is an even crazier based on daily comutes between MSA's

MSA's themselves are based on counties which I think is absurd especially out west with our massive counties

You have Podunk towns like Barstow, Blythe, Brawly and Calexico included in the costal city MSA's in So cal.

You have truck stop towns like Gila Bend over an hour from Phoenix in its MSA' because it happens to be on the far edge of a massive county
Agreed. CSA's are a bad metric. I lived just outside of Boston's MSA in NH but was included in its CSA but no way was it realistic or feasible to commute to it work or a regular basis and only went on a weekend every so often. NYC's CSA stretches into 'Deliverance' country way out in PA. LA's stretches from Ventura to the NV border.
Reply With Quote
     
     
  #19  
Old Posted Mar 26, 2020, 5:09 PM
iheartthed iheartthed is online now
Registered User
 
Join Date: Oct 2009
Location: New York
Posts: 12,181
Quote:
Originally Posted by JManc View Post
Agreed. CSA's are a bad metric. I lived just outside of Boston's MSA in NH but was included in its CSA but no way was it realistic or feasible to commute to it work or a regular basis and only went on a weekend every so often. NYC's CSA stretches into 'Deliverance' country way out in PA. LA's stretches from Ventura to the NV border.
But a lot of people do commute from PA to Manhattan daily.
Reply With Quote
     
     
  #20  
Old Posted Mar 26, 2020, 5:15 PM
JManc's Avatar
JManc JManc is offline
Administrator
 
Join Date: Feb 2003
Location: Houston
Posts: 23,138
Quote:
Originally Posted by iheartthed View Post
But a lot of people do commute from PA to Manhattan daily.
They are masochists. I've done that stretch several times. It might be different if there's transit involved but still a long haul. They did from where I lived in NH as well into Boston but quality of life is diminished when you're spending that long commuting. I knew people back home in Utica who commuted into Penn Station a few times a week. There are those who are super commuters..but no thanks.
Reply With Quote
     
     
This discussion thread continues

Use the page links to the lower-right to go to the next page for additional posts
 
 
Reply

Go Back   SkyscraperPage Forum > Discussion Forums > City Discussions
Forum Jump


Forum Jump


All times are GMT. The time now is 9:06 PM.


Powered by vBulletin® Version 3.8.7
Copyright ©2000 - 2026, vBulletin Solutions, Inc.