I use Inkscape. It's pretty simple to figure out.
After scanning the map in, I use the pen tool to trace the streets (using varying thicknesses and colours to represent street types) and put land use in a different layer, using the pen tool to draw solid shapes with different colours. Using the pen tool can be tricky but gets easier with practice. The hardest thing to do is probably making sure a grid aligns and all the streets are parallel (or at least look parallel); that's part of the reason my maps avoid large grids covering a whole area. I instead make small, local grids that are all disjointed.
I use a fairly similar process to the one employed by the author of Norscand, and he describes it better than I can on
this page, complete with video.
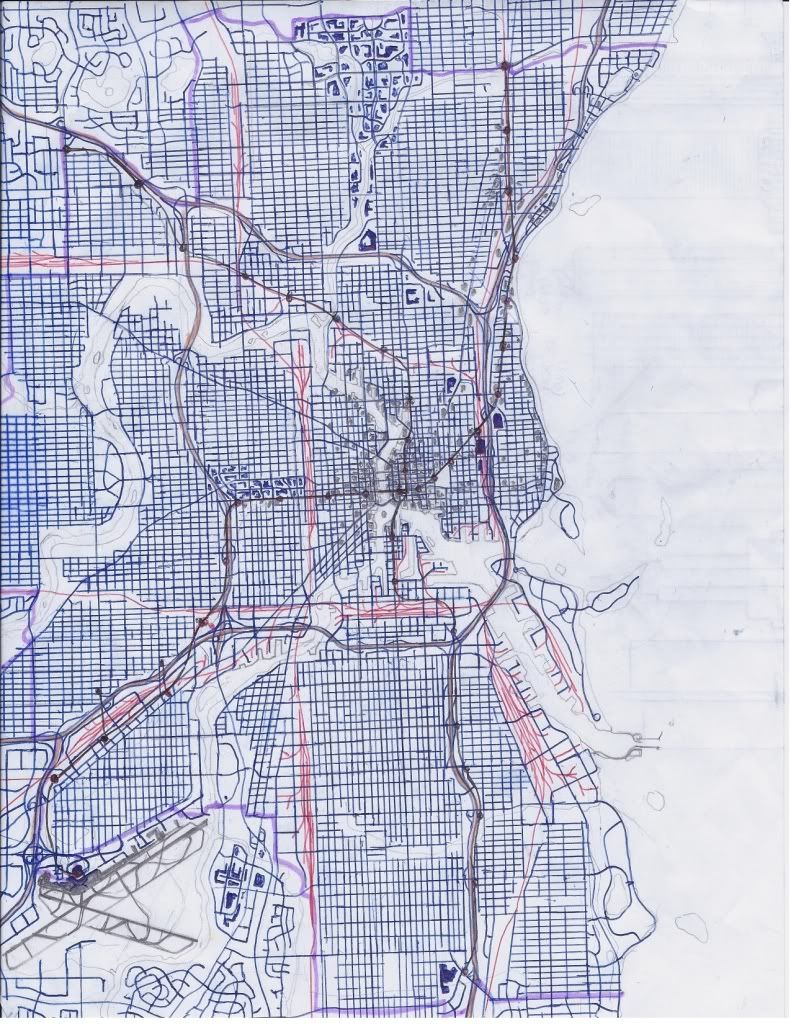
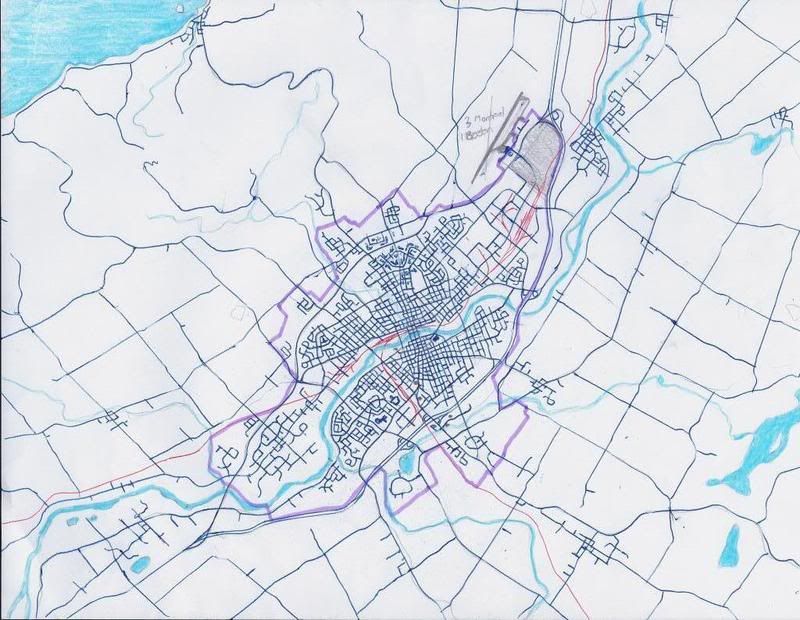
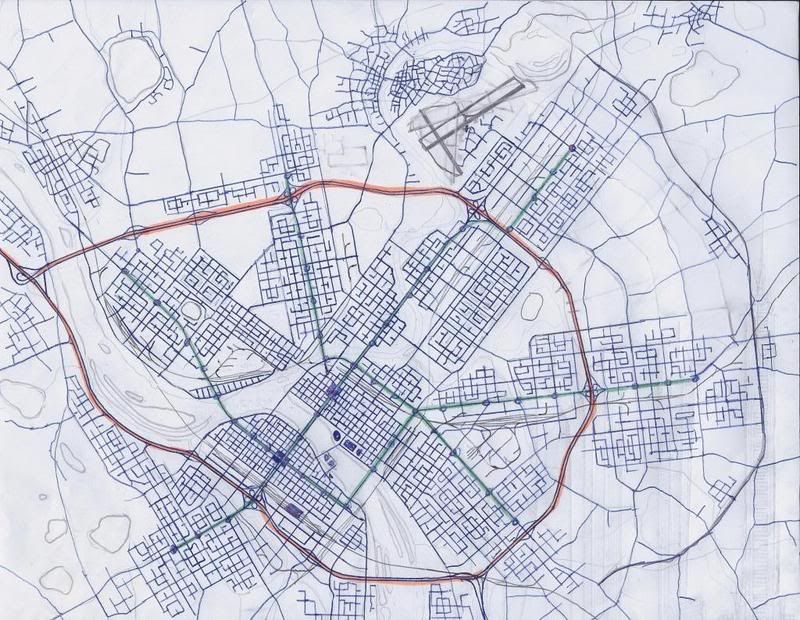
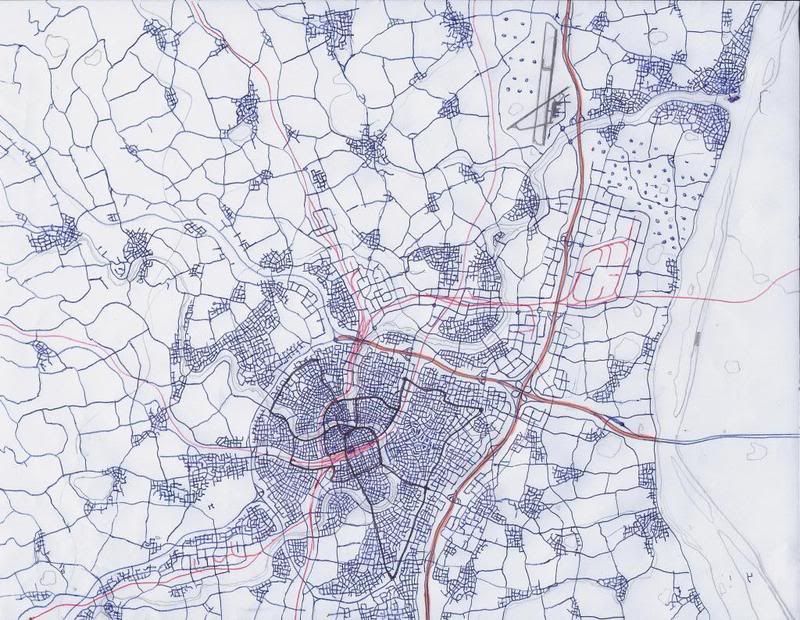
If you want to try digitizing and need a colour scheme, I've created a legend for my maps that includes icons. Finished projects at a neighbourhood scale look like
this (and don't be intimidated by that; years of practice and effort went into that, and I was unemployed at the time. Most of my maps make it nowhere near that level of completion).
Quote:
Originally Posted by Simpseatles

 Oh Wow! Not only do you do the same thing as me, our drawing styles are fairly similar. Nice job, and thanks so much for the link to your map! It looks almost like a google map when digitized. I would be interested to learn more about the digitizing process, since I'm not so great with computers!  |
Aside from installing Inkscape (which is a simple .exe file), the only thing you really need to know is how to use a mouse and keyboard. (And if you don't use shortcuts, you don't even need the keyboard for much.)
Here is a step-by-step. Don't be intimidated by its length, I just have difficulty explaining things in short, precise sentences.
The key to drawing a map in Inkscape is to understand the pen tool. It's the one you'll use 90% of the time. It can be intimidating at first but with practice gets very easy to use. The other 10% of the time, you'll use the object selection and vector selection tools, which are used to manipulate objects and points made with the pen after they're created. You'll need both for tweaking the map.
Before doing the map, open Inkscape and just play around with the pen tool a bit to get an idea of how it works. It's sort of a "click and drag" to make curved lines, and most vector points will have handles that you can control after drawing the line to manipulate the curve. As long as you don't click the first point you made, the line remains "unfinished", so you can add parts to it, or take parts away. Once you've drawn some lines, use the selection (white arrow) and vector selection (black arrow) tools and explore how they work.
When you're ready to try drawing a map, open a new Inkscape file.
Once you've imported the scanned image into Inkscape (just drag and drop; when a dialog comes up, make sure it isn't set to embed image, and then hit enter) and saved the file (saving is important; get into the habit of hitting ctrl+s occasionally, and set the autosave with backup files. Inkscape crashes sometimes and nothing is more frustrating than losing an hour of work because you didn't save), you have to figure out your scale. Draw a line on the map that you think is a kilometre or a mile (a km is usually about 8 to 10 blocks in Canadian cities), and then press "ctrl+a" to select the image and that line, and scale them by using the arrow grabbers around the image. I typically use a scale of 300px = 1km (roughly 500px per mile if you prefer that). It's just a rough guide, if you try to make everything a totally realistic dimension you'll go insane. Some of your city blocks will probably be huge, while others are tiny. The map I posted earlier has that issue; it's something I fix when I tweak the map later on.
Once you've scaled the image, you have to set the document page size to be equal to it. To make creating a png file of the map easier, I typically make sure the image is an even size (not 2164.664 px wide, for example. It doesn't have to be a nice, even number like 2200px, but you can do that if you like; I do). Once you've scaled the image and deleted the line you used to find the scale, select the image and hit "crtl+shift+d". This opens the document dimensions dialogue. Select "make document fit selection" (or whatever its called; it's a large button on the first panel, you can't miss it), and make sure the document is the same size as the map. Then lock the layer. (You can name it something, I usually call it "base map".)
Create a new layer above base map. Call it "waterways", and trace the water with the pen tool. This is a good warm up for using the pen tool; streets are almost always more simple than shorelines. (For a more organic look you can use the pencil tool but I wouldn't recommend that for beginners, as it can be frustrating. You can try it though.) Use a line with a stroke of 2px, dark blue. (Setting colours comes later; when you're tracing, you want contrast to separate what you've done and what needs to be done). I typically don't colour in the water at this stage, and you can re-do it later if you want. Streams are typically just blue lines. Once you've drawn the waterways, lock the layer.
Create a layer above that to draw roads. It easier to create a new layer for each class of road, and it is easier to start with bigger roads first. There are a couple options here.
You can nest layers in Inkscape, similar to how folders work on the computer's file system. You can have everything at the top level, sort of like putting all your folders in the C:/ drive directly, or you can organize them. I typically make a layer called "roads", then create a sublayer for each class of roadway. You can create sub-layers within sub-layers (within sublayers, etc; it's infinite) to organize things like cul-de-sac circles and thinner roadways (good for divided roads), but you probably won't do something that complex yet.
What I would recommend creating a road layer, then putting freeways, highways, arterials, collectors, and streets as sub-layers of that. Worry about other types of road path later. (I have things like transit streets and pedestrian trails on my maps; that's a complex detail that you'll get to once you've become more experienced.)
Use the pen tool to trace the roadways. I usually make Freeways 10px wide and blue, highways 8px wide and dark grey, arterial roads and collectors 6px wide and medium grey, local streets 5px wide, and lanes 2.5px wide, the latter two a slightly lighter shade of grey than arterials. Railways are a slightly darker shade of grey than highways, and are 4px wide for mainlines and 2px wide for spurs. The widths and colours help separate which kind of street is which.
For grid streets, you can just click at one end and then the other to draw a simple line. You can turn on the document's grid (shift+3) and the pen tool will snap to that (but that probably won't match your drawing), or use the ctrl button to get the lines to snap to angles (by default, they're every 15°) which is good if the grid is on an angle. There is a clone option (which I don't particularly like, but you can check it out if you want), but to make a grid I usually just use the duplicate option (ctrl+d) and move it over a bit.
As I said, all of this is less intimidating and simpler than my giant wall of text suggests. It simply takes a bit of practice to get used to how everything works, and where tools are located. If you want, I'll trace one of your maps and send you the SVG file so you can open it in Inkscape and explore what a "finished product" looks like.


 Prev
Prev


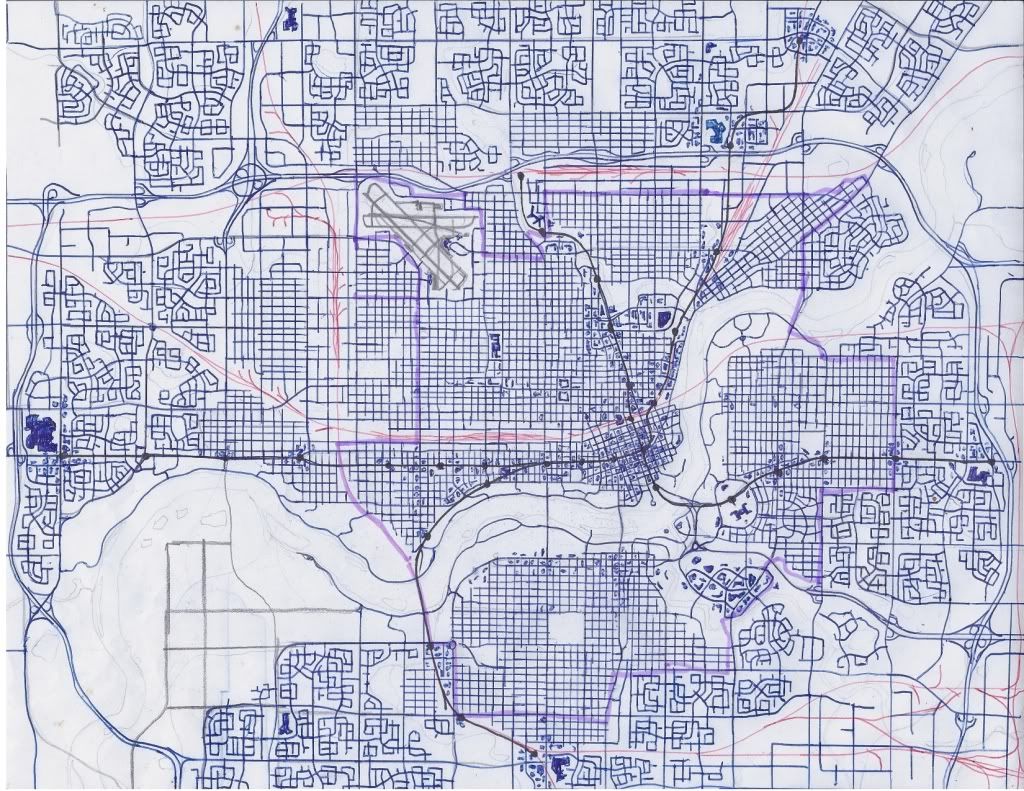
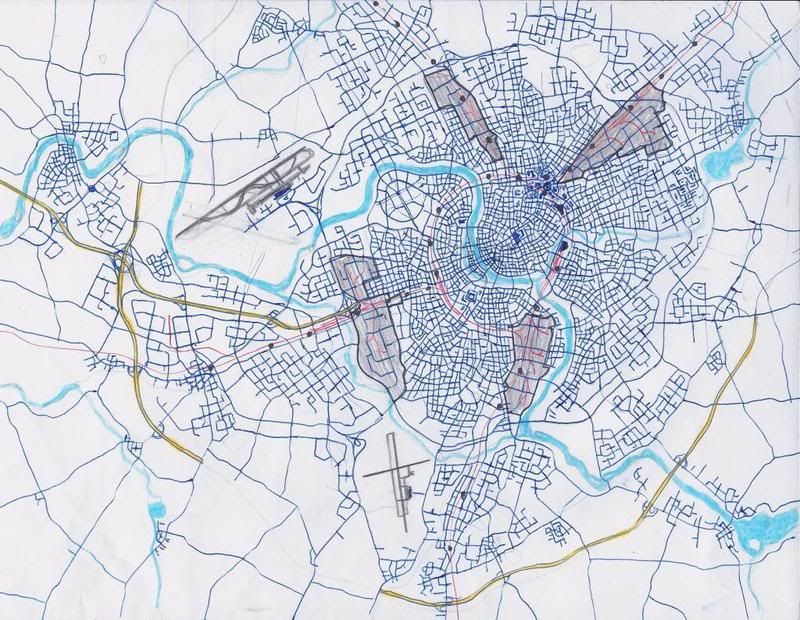
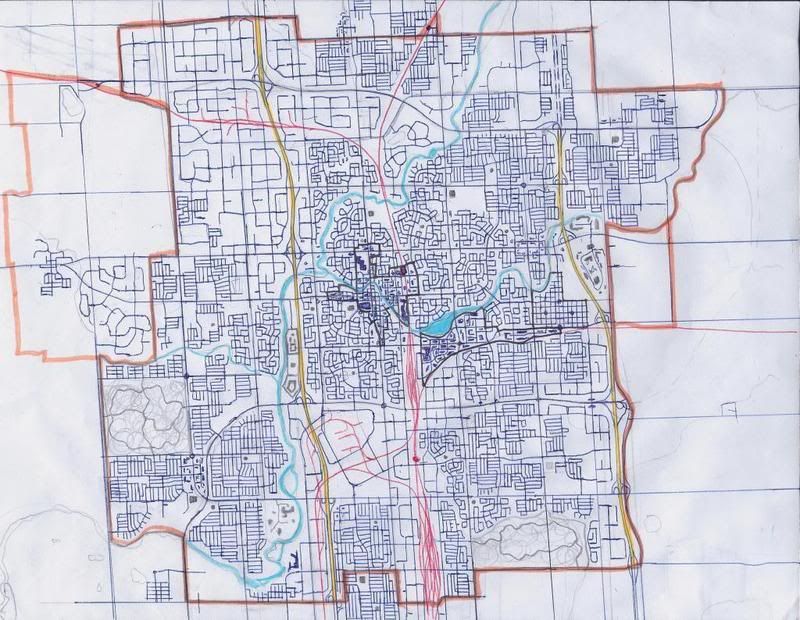
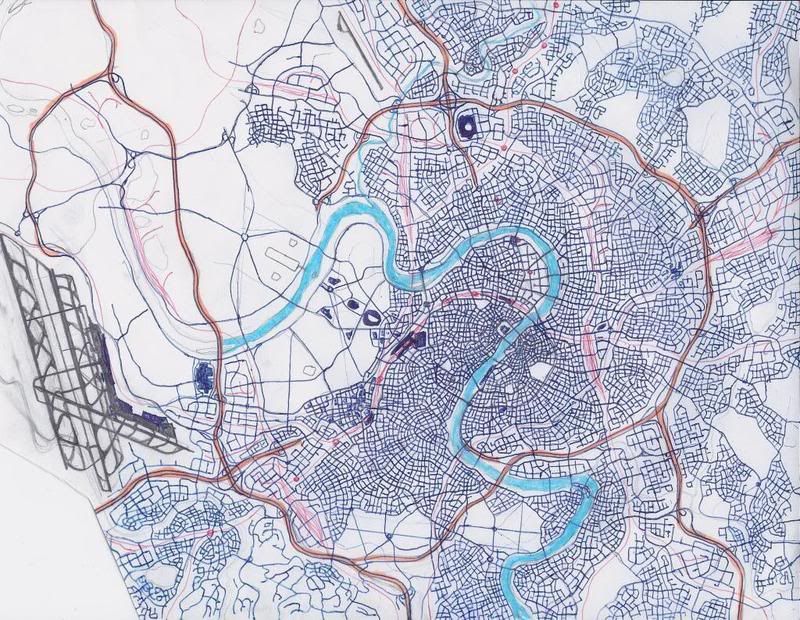
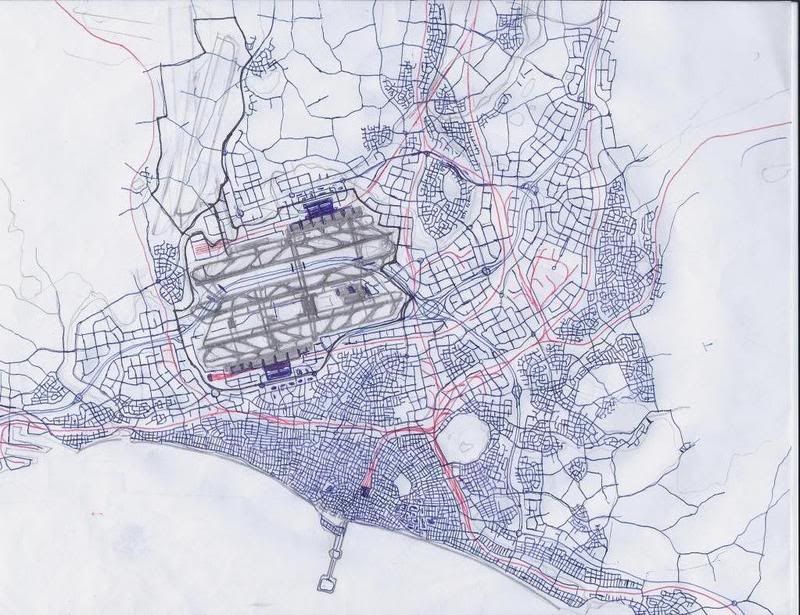
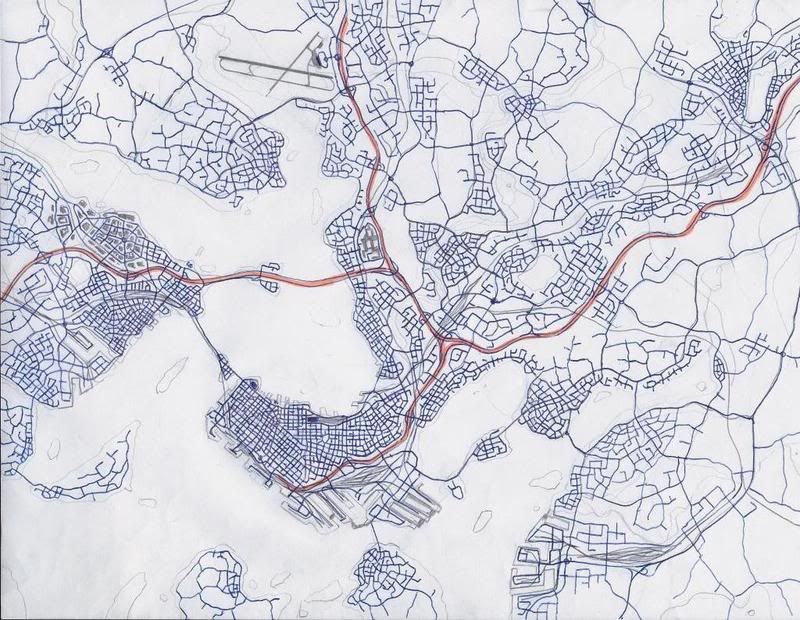
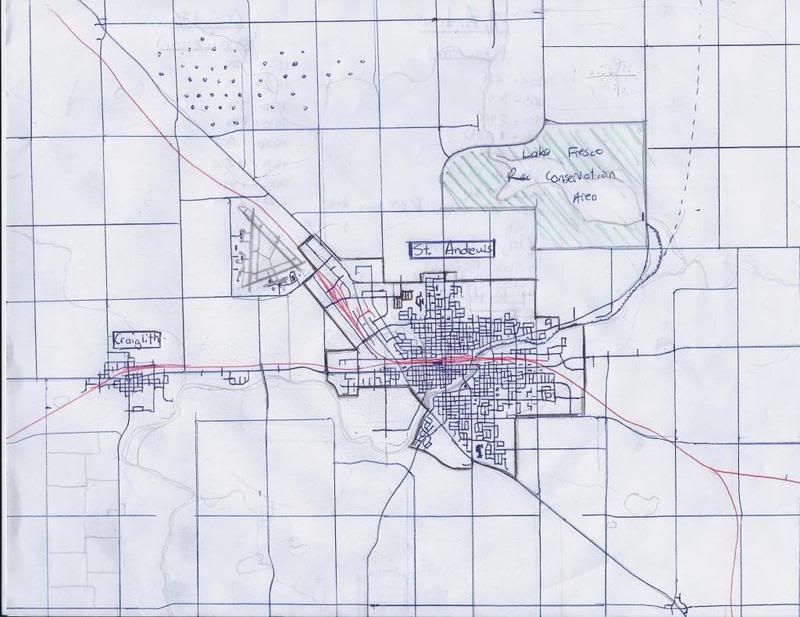
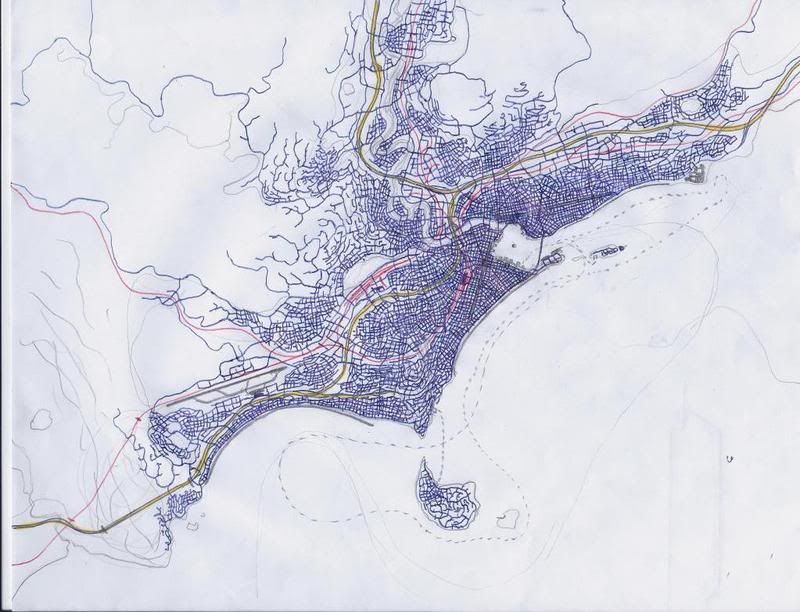
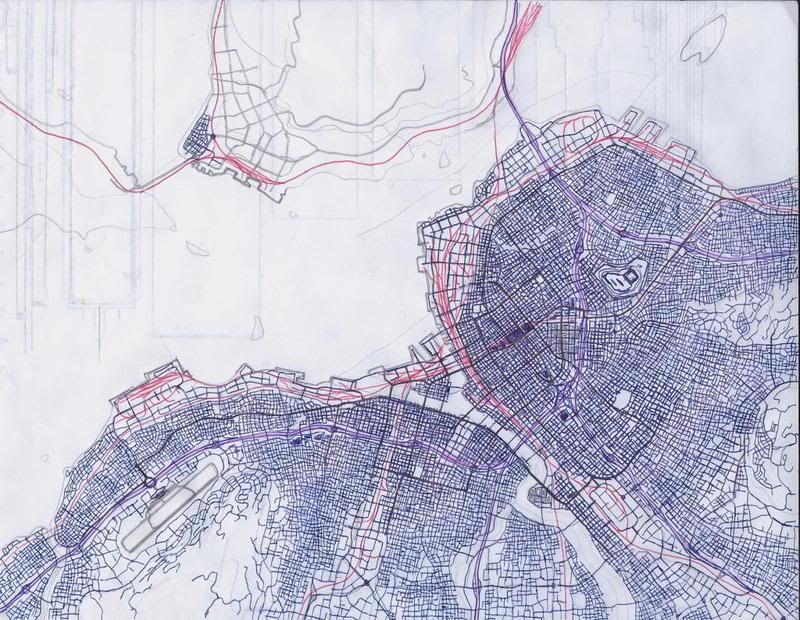
 These are just some of the better, and more recent ones that I'm posting today. I will definately try to post more in the future!


 Linear Mode
