HomeDiagramsDatabaseMapsForum About
     

Go Back   SkyscraperPage Forum > Regional Sections > Canada > Atlantic Provinces


Reply

 
Thread Tools Display Modes


  #1  
Old Posted May 10, 2023, 3:25 PM
MonctonRad's Avatar
MonctonRad MonctonRad is online now
Wildcats Rule!!
 
Join Date: Jun 2008
Location: Moncton NB
Posts: 41,078
Quote:
Originally Posted by David_99 View Post
The Government announced $50M in funding for a new BioAccelerator Research Centre on the island a couple months ago. Might have something to do with that?
Also a new med school at UPEI.
__________________
Go 'Cats Go
Reply With Quote
     
     
  #2  
Old Posted Apr 26, 2023, 3:55 PM
Bishop2047's Avatar
Bishop2047 Bishop2047 is offline
Registered User
 
Join Date: Jul 2012
Posts: 922
https://www.moneysense.ca/spend/real-estate/where-to-buy-real-estate-in-canada/

MoneySense has Moncton, SJ, Fredericton, and Halifax all in the top ten places to buy real estate. I don't get too excited about being included in these rankings, but the graphs do lay out home prices over the past few years in an easily comparable way.

Last edited by Bishop2047; Apr 26, 2023 at 3:55 PM. Reason: Spelling
Reply With Quote
     
     
  #3  
Old Posted May 10, 2023, 2:23 PM
Taeolas Taeolas is offline
Registered User
 
Join Date: Oct 2009
Location: Fredericton
Posts: 5,048
PEI's small enough that a big project or two could cause a big swing. NWT is similarly small enough to lead to big swings.

What's more impressive is BC's 36.6% change. BC's big enough that it takes a LOT for it to swing so much. Quebec is almost as impressive with a 19.9% bump for similar reasons.
Reply With Quote
     
     
  #4  
Old Posted May 10, 2023, 2:31 PM
josh_cat_eyes's Avatar
josh_cat_eyes josh_cat_eyes is offline
Registered User
 
Join Date: May 2009
Location: Moncton NB
Posts: 2,750
I wish they broke each province by type of building permit too.
__________________
We The People
Reply With Quote
     
     
  #5  
Old Posted Sep 29, 2023, 12:31 PM
Taeolas Taeolas is offline
Registered User
 
Join Date: Oct 2009
Location: Fredericton
Posts: 5,048
Yeah, at this pace, we'll break 900k in 2026, and be on good pace for 1M in 2030.

We definitely need to step up on construction, both housing and infrastructure, as well as recruiting support like teachers, doctors and nurses. But we'll probably need to boot Higgs out so we can finally start spending those surpluses he's been amassing on things we desperately need.
Reply With Quote
     
     
  #6  
Old Posted Nov 20, 2023, 2:48 PM
KnoxfordGuy's Avatar
KnoxfordGuy KnoxfordGuy is online now
New Brunswick booster!
 
Join Date: Jan 2011
Location: Fredericton, New Brunswick
Posts: 2,221
According to Stats Can, residential construction in NB was up 22.5% year over year in September to $294.3 million.
__________________
Fredericton. Noble Daughter Of The Forest.
Reply With Quote
     
     
  #7  
Old Posted Nov 21, 2023, 2:55 PM
MonctonRad's Avatar
MonctonRad MonctonRad is online now
Wildcats Rule!!
 
Join Date: Jun 2008
Location: Moncton NB
Posts: 41,078
I found this interesting infographic on Retail Talk & Share, and thought it belonged here:


This infographic has an NB bias, but includes all CMAs in Atlantic Canada.

While all the cities included show a healthy growth rate in the senior population, in terms of meaningful growth, ie the growth that influences economic growth and sustainability (working age and youth), then the growth centres are a little more select:

20 year Percentage Increase in the Youth Population:

1) Moncton - 22.2%
2) Fredericton - 10.7%
3) St. John's - 1.6%
4) Halifax - 1.3%

20 Year Percentage Increase in Working Age Population:

1) Moncton - 30.2%
2) Halifax - 24.6%
3) Fredericton - 22.5%
4) St. John's - 16.9%

It is really interesting to speculate why the working age population in Halifax is growing healthily, but, there is very little growth in the youth population in the city. One could posit this has a lot to do with the number of universities in the city, and the migration of students into the city to attend post secondary education. It might also have something to do with the white collar nature of the city and most 20-something immigrants being Yuppie DINKs as a result.

At the same time, why is the youth population growth rate in Moncton so high? Is this a reflection of the type of immigrants the city is getting? It would be really interesting to see if the Muslim population growth rate in the city is that much higher than it is in Halifax.

Early this year, the Anglophone East School Board in NB (which includes Moncton) made a ridiculous request of the provincial government for something like a dozen new schools in southeastern NB. I guess they were on to something.........

Finally, the senior's growth rates are going through the roof, no doubt explaining the current health care crisis in the country (at least in part, the pandemic did a number on us too in terms of people retiring or leaving the profession). It is interesting to note that the seniors growth rate in the CMAs is pretty much universally greater than in the CAs (Bathurst being a notable exception), indicating retirees may be moving to the larger cities once they are free of their jobs. Some of this migration might be related to wanting to live closer to their children. This was certainly true of my brother and sister-in-law who moved to Calgary from PEI because both of their children had moved out there.
__________________
Go 'Cats Go

Last edited by MonctonRad; Nov 21, 2023 at 3:22 PM.
Reply With Quote
     
     
  #8  
Old Posted Nov 21, 2023, 3:45 PM
adamuptownsj adamuptownsj is offline
Registered User
 
Join Date: Aug 2020
Location: Saint John NB
Posts: 2,024
Quote:
Originally Posted by MonctonRad View Post
I found this interesting infographic on Retail Talk & Share, and thought it belonged here:
Interesting Fire Emblem style character design lol. Fascinating stuff.

Saint John probably hit its deepest low ~2010-2014 so the working-age population treading water isn't as bad as it looks. Moncton is nuts. North Shore is apocalyptic. Complete retirement home level. I understand the Acadian Peninsula is not quite as grim, but I have no idea how to confirm that.

At this rate two seats will leave the north for Greater Moncton by the next boundary redistribution. One for Dieppe/Shediac/Moncton East and one for the Anglo part of town. Complete erosion of political capital up there. Rural Anglo NB by comparison will only lose one to Metro Fredericton. SJ-Kings-Charlotte agglomeration should remain similar, with 3 of the SJ seats and Quispamsis mildly shrinking in size, little change to Rothesay, Hampton, and Lancaster, and the 5 rural seats getting a little bigger. Maybe Arcadia-Butternut Valley-Maple Hills is the seat that gets carved up in the south... or Fredericton Grand Lake.

I'd be interested in seeing Sydney and Truro too.
Reply With Quote
     
     
  #9  
Old Posted Nov 21, 2023, 4:28 PM
SevenSquared SevenSquared is offline
Registered User
 
Join Date: Feb 2017
Location: Dieppe
Posts: 212
Quote:
Originally Posted by MonctonRad View Post
At the same time, why is the youth population growth rate in Moncton so high? Is this a reflection of the type of immigrants the city is getting? It would be really interesting to see if the Muslim population growth rate in the city is that much higher than it is in Halifax.
My take is that the stark difference in youth population growth rate between Moncton and Halifax is largely due to two things:

- The fact that Moncton has benefited massively from young families specifically moving here from Northern NB since the early 2000s

- It being so much easier for young people to start a family in Moncton than it is in Halifax due to the massive difference in house prices

It would be interesting to see a similar graphic with the cities that are more comparable to Moncton contextually, leaving out the capital cities, the small cities and large cities. Thinking along the lines of Kelowna, Saskatoon, Sudbury, Barrie, Kingston, Sherbrooke, Chicoutimi, SJ, Sydney etc
Reply With Quote
     
     
  #10  
Old Posted Nov 21, 2023, 4:32 PM
q12's Avatar
q12 q12 is offline
Registered User
 
Join Date: Mar 2008
Location: Halifax
Posts: 5,134
Reply With Quote
     
     
  #11  
Old Posted Nov 22, 2023, 2:17 AM
Bishop2047's Avatar
Bishop2047 Bishop2047 is offline
Registered User
 
Join Date: Jul 2012
Posts: 922
Quote:
Originally Posted by MonctonRad View Post
I found this interesting infographic on Retail Talk & Share, and thought it belonged here:


This infographic has an NB bias, but includes all CMAs in Atlantic Canada.

While all the cities included show a healthy growth rate in the senior population, in terms of meaningful growth, ie the growth that influences economic growth and sustainability (working age and youth), then the growth centres are a little more select:

20 year Percentage Increase in the Youth Population:

1) Moncton - 22.2%
2) Fredericton - 10.7%
3) St. John's - 1.6%
4) Halifax - 1.3%

20 Year Percentage Increase in Working Age Population:

1) Moncton - 30.2%
2) Halifax - 24.6%
3) Fredericton - 22.5%
4) St. John's - 16.9%

It is really interesting to speculate why the working age population in Halifax is growing healthily, but, there is very little growth in the youth population in the city. One could posit this has a lot to do with the number of universities in the city, and the migration of students into the city to attend post secondary education. It might also have something to do with the white collar nature of the city and most 20-something immigrants being Yuppie DINKs as a result.

At the same time, why is the youth population growth rate in Moncton so high? Is this a reflection of the type of immigrants the city is getting? It would be really interesting to see if the Muslim population growth rate in the city is that much higher than it is in Halifax.

Early this year, the Anglophone East School Board in NB (which includes Moncton) made a ridiculous request of the provincial government for something like a dozen new schools in southeastern NB. I guess they were on to something.........

Finally, the senior's growth rates are going through the roof, no doubt explaining the current health care crisis in the country (at least in part, the pandemic did a number on us too in terms of people retiring or leaving the profession). It is interesting to note that the seniors growth rate in the CMAs is pretty much universally greater than in the CAs (Bathurst being a notable exception), indicating retirees may be moving to the larger cities once they are free of their jobs. Some of this migration might be related to wanting to live closer to their children. This was certainly true of my brother and sister-in-law who moved to Calgary from PEI because both of their children had moved out there.
This is also because CMAs are (for the most part) the only locations where new long term care facilities are being built. Top of mind I can think of five recent rural long term care facility renovations/replacements but rarely is the bed total increased. Where as the Atlantic CMAs have had quite an influx of long term care facilities and beds.

Rural facilities are hard to staff, and private long term care is wary of investing in rural sites. This could account for the disproportionate +65 numbers in CMAs.
Reply With Quote
     
     
  #12  
Old Posted Nov 22, 2023, 3:39 AM
MonctonRad's Avatar
MonctonRad MonctonRad is online now
Wildcats Rule!!
 
Join Date: Jun 2008
Location: Moncton NB
Posts: 41,078


Good point. This is probably a factor in this, although not likely the complete explanation.
__________________
Go 'Cats Go
Reply With Quote
     
     
  #13  
Old Posted Nov 23, 2023, 1:39 PM
Drybrain Drybrain is offline
Registered User
 
Join Date: Sep 2012
Posts: 4,552
Quote:
Originally Posted by MonctonRad View Post

It is really interesting to speculate why the working age population in Halifax is growing healthily, but, there is very little growth in the youth population in the city.
That only appears to be the case when looking at the growth rate over the past 20 years, though, because Halifax lost so much youth between 2002 and 2012. From 2012 to 2022 the growth rate of the 14 and under population in Halifax was 12 percent. Since 2017 Halifax has had the highest youth growth rate of the cities on that chart.

The big question (I think) is why Halifax saw such a decline in youth in the oughts, while the NB cities did not. And then, why did such a total reversal occurred in the following ten years. I would guess something like: everywhere experienced youth drain to points west, but NB's cities attracted families from the north of NB, whereas families from the hinterlands of Nova Scotia mostly just left the province altogether. Now immigration and positive interprovincial migration is floating both NB and NS’ boats.

Just a guess though—I guess a detailed look at migration patterns within NB in the 2002-12 period would reveal if it’s accurate.
Reply With Quote
     
     
  #14  
Old Posted Nov 23, 2023, 4:17 PM
Bishop2047's Avatar
Bishop2047 Bishop2047 is offline
Registered User
 
Join Date: Jul 2012
Posts: 922
Quote:
Originally Posted by Drybrain View Post
That only appears to be the case when looking at the growth rate over the past 20 years, though, because Halifax lost so much youth between 2002 and 2012. From 2012 to 2022 the growth rate of the 14 and under population in Halifax was 12 percent. Since 2017 Halifax has had the highest youth growth rate of the cities on that chart.

The big question (I think) is why Halifax saw such a decline in youth in the oughts, while the NB cities did not. And then, why did such a total reversal occurred in the following ten years. I would guess something like: everywhere experienced youth drain to points west, but NB's cities attracted families from the north of NB, whereas families from the hinterlands of Nova Scotia mostly just left the province altogether. Now immigration and positive interprovincial migration is floating both NB and NS’ boats.

Just a guess though—I guess a detailed look at migration patterns within NB in the 2002-12 period would reveal if it’s accurate.
It is a little disappointing not having PEI represented on this chart. I am curious if PEI cities mirrored NS/NB or neither, during these specific time frames.

As a province PEI looks like....


2001

Total Population - 135,295

0-14: 26,650 (19.7)

15-64: 90,080 (66.6%)

65+: 18,575 (13.7%)


2011

Total Population - 140,204

0-14: 23,060 (16.4%)

15-64: 94,360 (67.4%)

65+: 22,785 (16.3%)


2021

Total Population - 154,330

0-14: 23,640 (15.3%)

15-64: 97,985 (63.5%)

65+: 32,705 (22%)
Reply With Quote
     
     
  #15  
Old Posted Dec 7, 2023, 1:21 PM
Taeolas Taeolas is offline
Registered User
 
Join Date: Oct 2009
Location: Fredericton
Posts: 5,048
This CBC article is mainly about the Halifax housing gap, but it also has an infographic for the other municipalities in Nova Scotia and their housing needs and anticipated housing needs.

From peeking around the graphic if I'm reading it right, it looks like while Halifax has the greatest gap by far, Cape Breton surprisingly has some largish gaps as well. Sydney's gap is 1000 homes, and even the other municipalities on the island have gaps of hundreds, or even almost 500.

The South shore seems to be in decent shape for the most part, aside from Lunenburg/Bridgewater area where there's another big gap of about a thousand.

Amherst and Antigonish both has a largest gap of about 500, but Truro and Stellarton area seem to be in decent shape. Wolfville area seems to be borderline okayish.
Reply With Quote
     
     
  #16  
Old Posted Dec 7, 2023, 2:17 PM
Spitfire75 Spitfire75 is offline
Registered User
 
Join Date: Oct 2007
Location: Halifax
Posts: 254
Quote:
Originally Posted by Taeolas View Post
This CBC article is mainly about the Halifax housing gap, but it also has an infographic for the other municipalities in Nova Scotia and their housing needs and anticipated housing needs.

Take that housing needs report with a big grain of salt. The report used census data from 2016-2021 to predict future trends, which we know has significantly changed in the last couple years.


For example in this CBC article where the report said Pictou had "no anticipated demand for housing in the near term," adding there might even be a "surplus by 2023." But, the town saw a 94 per cent increase in the median home price over three years and the cost of new rentals coming on the market can be as high as $2,000 per month.


Another example from the same article, the town of Stewiacke where the report identified a gap of 50 units, and the town's assessment suggested five new units could be completed annually. But, in the last three years the town has approved 74 new single-family homes, most of which are "either underway or built." There are also nine different apartment projects approved totalling 86 units.


It really makes me wonder how accurate the report's numbers are for other municipalities.
Reply With Quote
     
     
  #17  
Old Posted Jan 2, 2024, 12:36 PM
MonctonRad's Avatar
MonctonRad MonctonRad is online now
Wildcats Rule!!
 
Join Date: Jun 2008
Location: Moncton NB
Posts: 41,078
For reference purposes, here are the populations of the Atlantic provinces as of early morning January 2nd, 2024. These numbers come from the Statistics Canada population clock. We can use this information to compare growth rates for the upcoming year.

NS - 1.070,247
NB - 845,207
NL - 541, 407
PE - 176,232

TOTAL - 2,633,093
__________________
Go 'Cats Go

Last edited by MonctonRad; Jan 2, 2024 at 2:31 PM.
Reply With Quote
     
     
  #18  
Old Posted Jan 8, 2024, 12:41 AM
mmmatt's Avatar
mmmatt mmmatt is offline
Our Tide is Rising
 
Join Date: Feb 2007
Posts: 2,755
Apologies this is a very NB focused chart but something I created for an NB (Facebook) group which was subsequently deleted for a reason outside my full understanding.

The province of NB has all statistics for school populations by grade in a detailed dataset available to the public online, this is a chart I made showing us the change in the "TOP 15" largest schools in the province.

Please note the data for 2023 is at the end of last school year, this is the most recent available, there has been continued growth in many schools for our current school year.

Someone mentioned in the comments before deletion that Le Sommet and Ecole Champlain are now smaller due to the completion of the new francophone school in Moncton East this year. I bolded them because it is historically odd for them to be so large since they are not high schools.

Someone else mentioned Riverview High has jumped up again to over 1200 students this year.


Last edited by mmmatt; Jan 8, 2024 at 4:55 AM.
Reply With Quote
     
     
  #19  
Old Posted Jan 8, 2024, 4:49 AM
mmmatt's Avatar
mmmatt mmmatt is offline
Our Tide is Rising
 
Join Date: Feb 2007
Posts: 2,755
Arrow

Here is another New Brunswick focused statistics post related to our recent local governance reform.

These are 2023 numbers.

For more details on the areas and the local governance reforms in general the province has this handy website: https://www2.gnb.ca/content/gnb/en/corporate/promo/local-governance.html

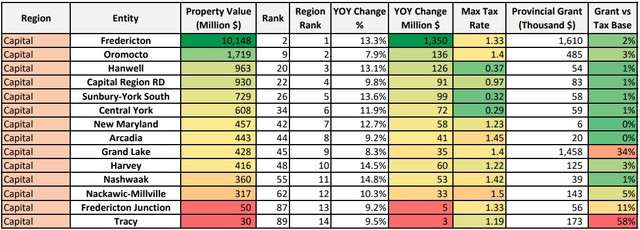
First I have a look at the "1 Billion Club" of New Brunswick, municipalities which have passed the billion dollar mark for property values.

To me Shediac is the biggest interest here, they are the fastest growing percentage wise for property values which accounts for new construction and natural increase in existing properties. If these numbers remain similar Shediac could rocket up to 7th place in the province within the next few years passing even Miramichi.

The other big news is the new versions of Moncton and Fredericton both have surpassed the 10 Billion mark in property value. With the essentially contiguous urban area of Moncton/Dieppe hitting the 15 Billion mark.

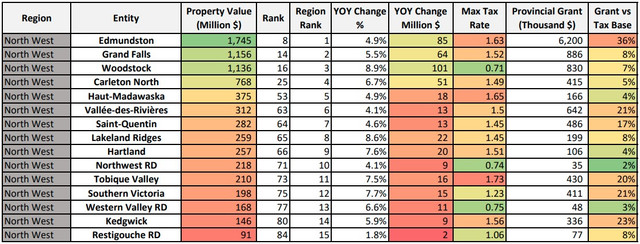
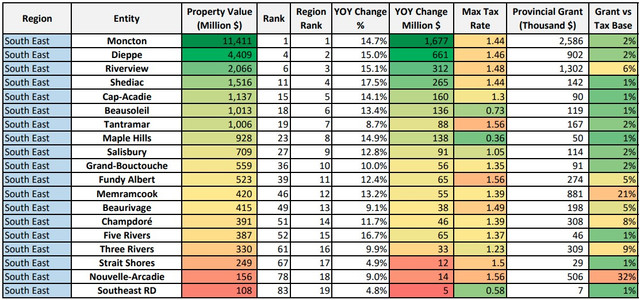
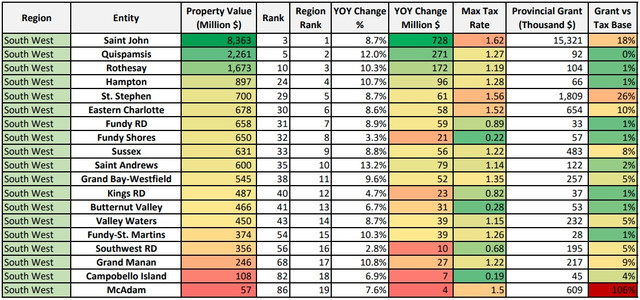
I included some information about tax rates and the provincial grant money afforded to each entity since it is another interesting sidebar. For the "Grant vs Tax Base" please note this is exaggerated for better comparison otherwise the numbers are too small to be meaningful.


Next I have broken down each "sub region" which I kind of invented based on geography.

First is the Capital Region. If my "Grant vs Tax Base" column can be understood as an informal barometer for the fiscal health of an entity this region is certainly experiencing overall excellent fiscal health! Most of the areas in this region are growing quickly as well above 10% in tax base year over year.


The next region is North East, we all know this region has struggled in recent decades. None of the entities in this region saw their tax base increase more than 10% and the provincial grants are higher than average as well.


Next is the North West region.


The South East region is next, home to the most (7) members of the billion dollar club. This region is seeing some of the fastest growth in tax base and is generally in good fiscal standing.


Finally the South West region, mixed results with some areas growing quick and others growing slower. I don't know whats going on in McAdam but they are certainly needing a lot of help from the province they have the largest per capita. Saint John has the largest grant in terms of actual dollars but I think this is related to some kind of correction due to intentional undervaluation of heavy industrial properties?


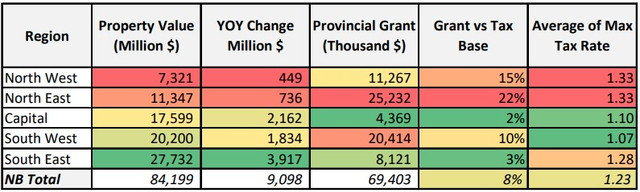
Lastly here is a look at the regional totals. Amazing to think the small capital region encompasses nearly as much tax base as the entire north half of the province

Also astounding to see the provincial tax base grow by 9 billion in a single year, the tide of immigration from various sources is certainly pushing property values way up in general.

Reply With Quote
     
     
  #20  
Old Posted Jan 8, 2024, 12:41 PM
MonctonRad's Avatar
MonctonRad MonctonRad is online now
Wildcats Rule!!
 
Join Date: Jun 2008
Location: Moncton NB
Posts: 41,078


Very interesting stats mmmatt.

So, the greater Moncton POPCTR (Moncton, Riverview, Dieppe) would have a total property valuation of $17,866,000,000.

These three communities represent half of the top six communities in the province in terms of valuation.
__________________
Go 'Cats Go
Reply With Quote
     
     
This discussion thread continues

Use the page links to the lower-right to go to the next page for additional posts
 
 
Reply

Go Back   SkyscraperPage Forum > Regional Sections > Canada > Atlantic Provinces
Forum Jump


Forum Jump


All times are GMT. The time now is 6:35 PM.


Powered by vBulletin® Version 3.8.7
Copyright ©2000 - 2026, vBulletin Solutions, Inc.