Quote:
Originally Posted by chris08876

|
This also helps to understand the Diversity Index:
Figure 2, the second hypothetical example, shows a population with four equally sized groups where the DI is 75%. The chance that the two people come from different race and ethnic groups is increased, even though the size of each group is smaller than in the first example.
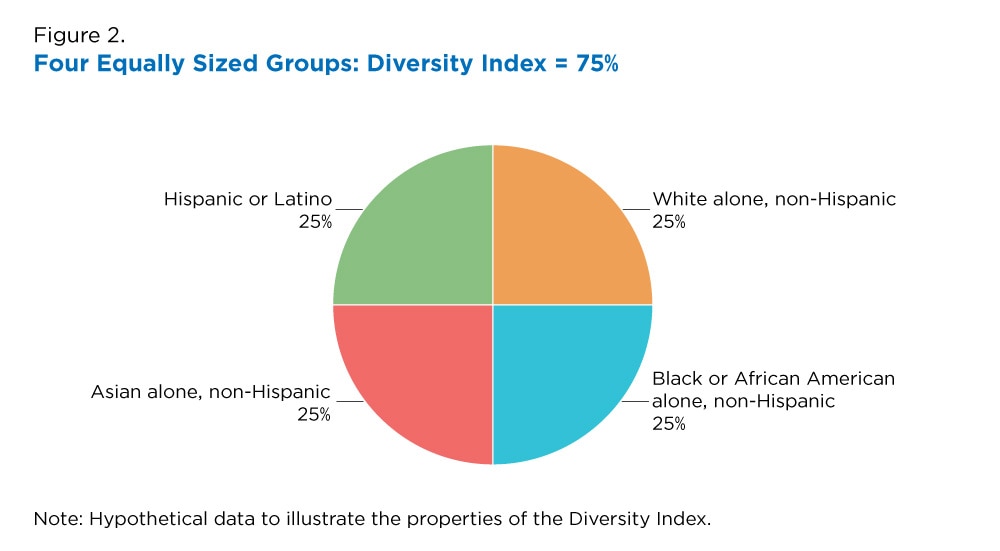
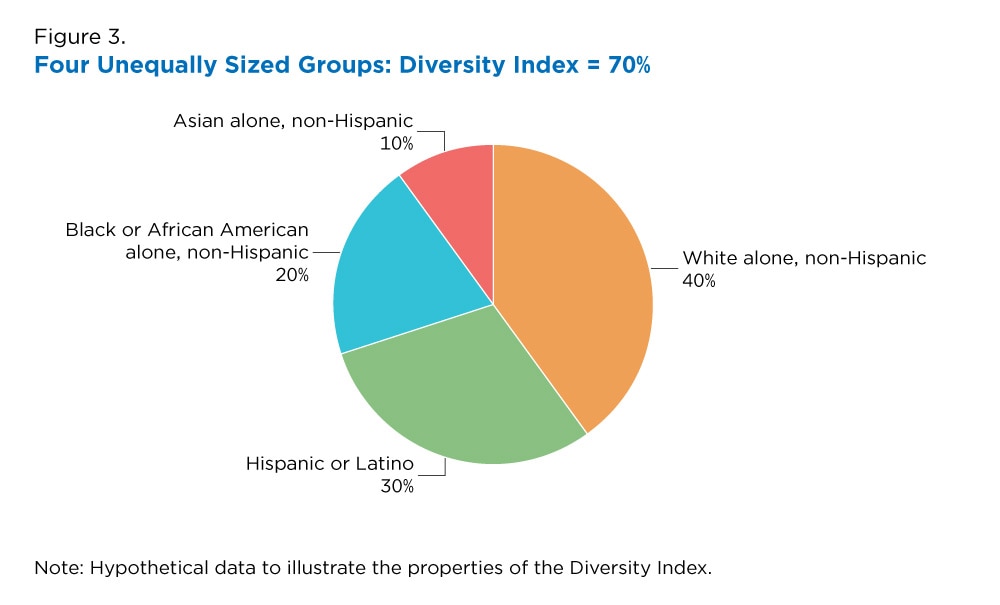
Figure 3 shows a hypothetical population with four unequally sized groups and a DI of 70%. Comparing Figure 2 and Figure 3, we see that the relative size of the racial and ethnic groups affects the DI score by decreasing the probability when some groups are larger than the others.
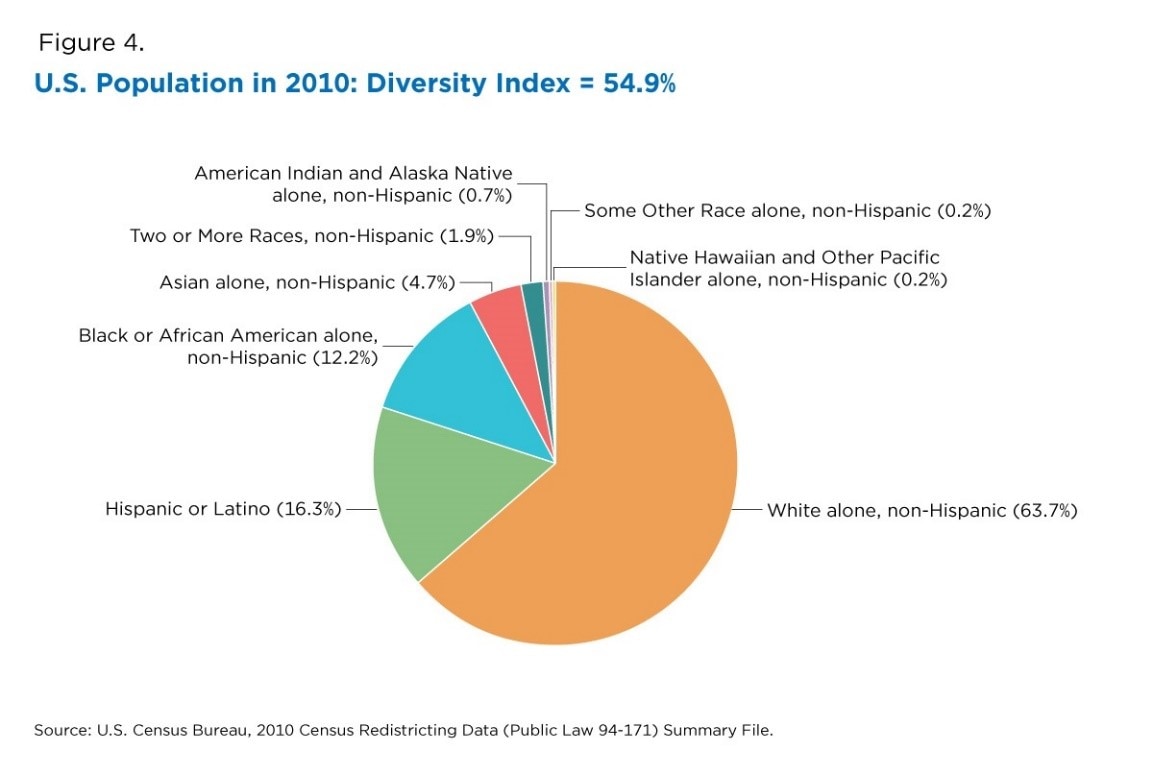
The DI for actual data from the 2010 Census for the United States and selected states illustrate how the metric can vary based on the distribution of the population by race and ethnicity. In 2010, there was a 54.9% chance that two people chosen at random from the U.S. population would be from different race or ethnicity groups (Figure 4).
In 2020 the DI score increased to 61.1%.
 Prevalence Rankings and Diffusion Score
We can also measure racial and ethnic diversity using prevalence rankings and the diffusion score.
With prevalence rankings, which show the most common group in an area, we look at patterns in the percentage of the population that falls into the largest race or ethnic group, second-largest group, and third-largest group. The prevalence ranking approach uses tables or graphs to show the percentages of the largest groups.
From the rankings on 2010 Census data, we find:
The White alone, non-Hispanic population was the largest racial or ethnic group in the United States at 63.7%.
The Hispanic population was the second-largest at 16.3%.
The Black or African American alone, non-Hispanic population was third-largest at 12.2%.
The diffusion score measures the percentage of the population that is not in the first-, second- or third-largest racial and ethnic groups combined. This metric tells us how diverse and unconcentrated the population is relative to the three largest groups.
For example, the diffusion score for the United States was 7.7% in 2010, as 7.7% of the population was not one of the three largest racial or ethnic groups. When we look across the country, we see a lot of variation in the diffusion scores by state in 2010.
The Diffusion Score in 2020 was 11.4%.
The diffusion score was highest in Hawaii at 20.1% (21.8% in 2020), indicating that one-fifth of the population was in a racial or ethnic group that was not one of the three largest groups for the state.
The next highest diffusion score was for Alaska with 15.1% (17.9% in 2020), followed by Oklahoma with 14.3% (17.8% in 2020).
The lowest diffusion score was in West Virginia at 2.1%.


 Prev
Prev


 My entire life I have considered the cities and towns part of the old Pacific Bell Oakland phone book to be the immediate Oakland-Berkeley 'Area'. I know there's a lot of building, but


 and it definitely feels like it.


 Linear Mode
