HomeDiagramsDatabaseMapsForum About
     

Go Back   SkyscraperPage Forum > Regional Sections > Canada


Reply

 
Thread Tools Display Modes
     
     
  #1061  
Old Posted Dec 20, 2020, 11:31 PM
Chadillaccc's Avatar
Chadillaccc Chadillaccc is offline
ARTchitecture
 
Join Date: Feb 2011
Location: Cala Ghearraidh
Posts: 22,842
Quote:
Originally Posted by kwoldtimer View Post
Under 15O metres, I’d wager.
Ah right on. I love the drive down Avenue Road, you really see the difference in elevation there.


I came across this beauty of the City of Calgary, it's a bit old (from 2009) but still holds up. Really shows you the steep cliffs surrounding downtown, and you can see the stark contrast of where the Prairies end in the eastern 1/3 of the city and the Foothills of the Rockies in the western 2/3...

The elevation difference between our highest and lowest points is about 320 meters...


http://www.mappery.com/Calgary-Topo-Bike-Map
__________________
Strong & Free

Mohkínstsis — 1.6 million people at the Foothills of the Rocky Mountains, 400 high-rises, a 300-metre SE to NW climb, over 1000 kilometres of pathways, with 20% of the urban area as parkland.
Reply With Quote
     
     
  #1062  
Old Posted Dec 20, 2020, 11:36 PM
Architype's Avatar
Architype Architype is online now
♒︎ verified human
 
Join Date: Mar 2004
Location: 🍁 Canada
Posts: 14,069
Reply With Quote
     
     
  #1063  
Old Posted Dec 21, 2020, 1:46 AM
Andy6's Avatar
Andy6 Andy6 is offline
Starring as himself
 
Join Date: Mar 2002
Location: Toronto Yorkville
Posts: 9,764
Quote:
Originally Posted by MonkeyRonin View Post
Neat. I can see the ridge to the east of the DVP and south of the 401. That's where a relative of mine lives (NW of Vic Park and Lawrence) and it is really high. They get a nice breeze in summertime. Nice neighbourhood.
__________________
crispy crunchy light and snappy
Reply With Quote
     
     
  #1064  
Old Posted Dec 21, 2020, 5:46 AM
VANRIDERFAN's Avatar
VANRIDERFAN VANRIDERFAN is offline
Registered User
 
Join Date: Jan 2007
Location: Regina
Posts: 5,484
Not that flat!


An interesting look at the Manitoba at the 49th.
Reply With Quote
     
     
  #1065  
Old Posted Dec 21, 2020, 5:59 AM
Bishop2047's Avatar
Bishop2047 Bishop2047 is offline
Registered User
 
Join Date: Jul 2012
Posts: 927


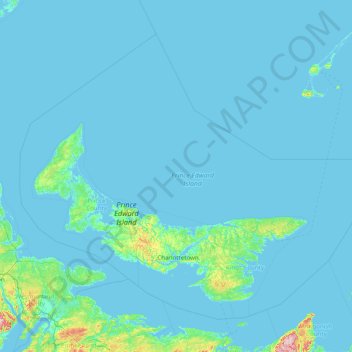
NS and PEI


NB
Reply With Quote
     
     
  #1066  
Old Posted Dec 21, 2020, 6:27 AM
someone123's Avatar
someone123 someone123 is offline
hähnchenbrüstfiletstüc
 
Join Date: Nov 2001
Location: Vancouver
Posts: 35,895
The scale matters for these elevation maps. A change in elevation of 100 m over 1 km is very noticeable, but over 100 km it isn't.

That NS map is pretty low resolution or just kind of misleading. You can hit 150 m elevation in less than 3 km from the Bedford Basin. Parts of Clayton Park are 150 m. NS barely has real mountains but there are spots with 50 m+ cliffs (e.g. Eagle Rock in Bedford) that are pretty nice in person, while the highest elevation points (e.g. Blue Mountain peak) feel only marginally taller than the surrounding area. A lot of NS is "lumpy", with many small-ish hills of similar height and not much flat land, so the highest point in a given area doesn't necessarily stand out much.
Reply With Quote
     
     
  #1067  
Old Posted Dec 21, 2020, 6:42 AM
lio45 lio45 is offline
BANNED
 
Join Date: Aug 2007
Location: Quebec
Posts: 44,901
One of my pet peeves is maps where the color spectrum for the scale goes from one extreme color to another based only on the data range that's in the map itself. For example, a photovoltaic potential map of Nunavut where Ellesmere Island is dark blue and the southern area near the Manitoba border is bright red.

Elevation maps can easily fall into that trap. A PEI map could have the scale calibrated so 140 m is dark brown and sea level is green, and it would look like a very mountaineous island at first sight (until the viewer decides to look at the actual numbers and realizes a more correct map would have the entire island in green, with the scale used being a continent-wide one where the values in brown and beige are just absent from the island).
Reply With Quote
     
     
  #1068  
Old Posted Dec 21, 2020, 6:45 AM
someone123's Avatar
someone123 someone123 is offline
hähnchenbrüstfiletstüc
 
Join Date: Nov 2001
Location: Vancouver
Posts: 35,895
It all depends on what you want to visualize and whether or not you're interpreting it correctly. If you want to see small changes in elevation on PEI then the scale that matches the elevations might make sense. If you're comparing PEI and NB in two maps you want the same scale. If you're looking for alpine environments you want the scale that shows you that; PEI has 0 such areas. The photovoltaic potential map maybe not so much if the goal is generating power and the potential is mediocre to bad everywhere.

Of course in climate discussions for Canada many people misapply this scaling by effectively saying that whatever's around the southermost end of the country is amazing while anything somewhat colder than that is intolerable and awful (often with extremely sparse/biased sampling techniques; just a couple arbitrary points rather than a filled in area like this).
Reply With Quote
     
     
  #1069  
Old Posted Dec 21, 2020, 6:47 AM
lio45 lio45 is offline
BANNED
 
Join Date: Aug 2007
Location: Quebec
Posts: 44,901


Lots of erosion went on in PEI between the first map and the second map!
Reply With Quote
     
     
  #1070  
Old Posted Dec 21, 2020, 6:52 AM
lio45 lio45 is offline
BANNED
 
Join Date: Aug 2007
Location: Quebec
Posts: 44,901
Quote:
Originally Posted by someone123 View Post
Of course in climate discussions for Canada many people misapply this scaling by effectively saying that whatever's around the southermost end of the country is amazing while anything somewhat colder than that is intolerable and awful (often with extremely sparse/biased sampling techniques; just a couple arbitrary points rather than a filled in area like this).
Paraphrasing George Carlin: "Any Canadian climate that's at least ever-so-slightly [colder and/or less sunny and/or snowier and/or rainier and/or less reliably hot in summer] than the climate of your home region is just unlivable."
Reply With Quote
     
     
  #1071  
Old Posted Dec 21, 2020, 6:58 AM
someone123's Avatar
someone123 someone123 is offline
hähnchenbrüstfiletstüc
 
Join Date: Nov 2001
Location: Vancouver
Posts: 35,895
Quote:
Originally Posted by lio45 View Post
Lots of erosion went on in PEI between the first map and the second map!
While the light green spots are the most boring topographically they're also the most developed and economically successful. Those reddish bands in northern NS and southern NB are empty areas, and the one in NS is annoying because the main highway runs through it and it has worse than normal weather due to a combination of factors (elevation + storm track up Bay of Fundy). Plus it's tolled.
Reply With Quote
     
     
  #1072  
Old Posted Dec 21, 2020, 7:26 AM
Nashe's Avatar
Nashe Nashe is offline
Registered User
 
Join Date: Feb 2009
Location: Moncton, NB
Posts: 3,071
Quote:
Originally Posted by someone123 View Post
...the one in NS is annoying because the main highway runs through it and it has worse than normal weather due to a combination of factors (elevation + storm track up Bay of Fundy). Plus it's tolled.
"Hey! You didn't get stuck in a snow squall! Awesome! That'll be four bucks..."
Reply With Quote
     
     
  #1073  
Old Posted Dec 21, 2020, 1:13 PM
Innsertnamehere's Avatar
Innsertnamehere Innsertnamehere is offline
Registered User
 
Join Date: Jan 2010
Location: Hamilton
Posts: 12,865
I thought the Cobequid pass tolls were sent to the government and weren’t directly payable by drivers? I don’t recall paying a toll when I drove the road 5 years ago or so.
Reply With Quote
     
     
  #1074  
Old Posted Dec 21, 2020, 1:54 PM
Acajack's Avatar
Acajack Acajack is offline
Gros Méchant Loup
 
Join Date: Aug 2006
Location: Province 2, Canadian Empire
Posts: 72,949
Quote:
Originally Posted by Innsertnamehere View Post
I thought the Cobequid pass tolls were sent to the government and weren’t directly payable by drivers? I don’t recall paying a toll when I drove the road 5 years ago or so.
No you definitely pay a toll when you drive through there. I paid it about 2 years ago on my last driving trip to Nova Scotia.
__________________
Loin des yeux, loin du coeur.
Reply With Quote
     
     
  #1075  
Old Posted Dec 21, 2020, 1:56 PM
MonctonRad's Avatar
MonctonRad MonctonRad is offline
Wildcats Rule!!
 
Join Date: Jun 2008
Location: Moncton NB
Posts: 41,163
Quote:
Originally Posted by Innsertnamehere View Post
I thought the Cobequid pass tolls were sent to the government and weren’t directly payable by drivers? I don’t recall paying a toll when I drove the road 5 years ago or so.
Most of the TCH between Edmundston and Salisbury (west of Moncton) is private, with "shadow tolls" paid by the government.

The Cobequid Pass in NS sadly is still tolled. It is $4 for a passenger car each way.
__________________
Go 'Cats Go
Reply With Quote
     
     
  #1076  
Old Posted Dec 21, 2020, 1:57 PM
Metro-One's Avatar
Metro-One Metro-One is online now
Registered User
 
Join Date: Sep 2008
Location: Japan
Posts: 17,990
I do hope that everyone here realizes that you are all comparing / displaying maps with completely different color gradients and vertical exaggerations.

That horizontal view of Manitoba is using a vertical exaggeration of 100X!

For example you can make Florida look like the Rocky Mountains if you give each metre of elevation a different color representation and or an extreme vertical exaggeration.
__________________
Bridging the Gap
Check out my Flickr: https://www.flickr.com/photos/30634635@N03/with/29495547810/ and Youtube channel https://www.youtube.com/channel/UCV0_0h9qKlhxXFxuAey_q6Q
Reply With Quote
     
     
  #1077  
Old Posted Dec 21, 2020, 2:44 PM
MonctonRad's Avatar
MonctonRad MonctonRad is offline
Wildcats Rule!!
 
Join Date: Jun 2008
Location: Moncton NB
Posts: 41,163


We do (I do at least)

Here's a topographical map of Moncton:
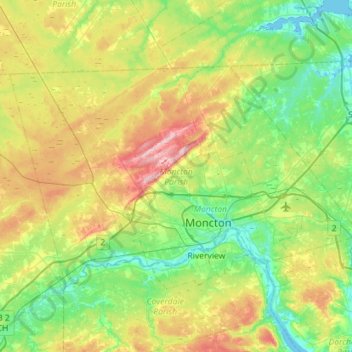


I realize the relief is exaggerated, but it is meaningful nonetheless. It allows you to see the breadth of the Petitcodiac River Valley, and explains why the river takes that 90 degree bend at Moncton, heading WSW rather than NNW.

Lutes Mountain to the NW of Moncton may just rise to 220 metres, but that elevation change is enough to be meaningful. There are at least several times per year that the top of Lutes Mountain will have snow on it, but the land down in the city proper is bare.

__________________
Go 'Cats Go
Reply With Quote
     
     
  #1078  
Old Posted Dec 21, 2020, 2:56 PM
Metro-One's Avatar
Metro-One Metro-One is online now
Registered User
 
Join Date: Sep 2008
Location: Japan
Posts: 17,990
Quote:
Originally Posted by MonctonRad View Post


We do (I do at least)

Here's a topographical map of Moncton:


I realize the relief is exaggerated, but it is meaningful nonetheless. It allows you to see the breadth of the Petitcodiac River Valley, and explains why the river takes that 90 degree bend at Moncton, heading WSW rather than NNW.

Lutes Mountain to the NW of Moncton may just rise to 220 metres, but that elevation change is enough to be meaningful. There are at least several times per year that the top of Lutes Mountain will have snow on it, but the land down in the city proper is bare.

You would be surprised at how many people don’t actually look at the data parameters for a map or graph (good example of this was a map posted years ago after Fukushima that displayed ocean currents, but everyone saw “red” and “green” spots so assumed it meant radiation levels and freaked out sharing the misunderstood image like wildfire). This was actually when I started to realize that there are a lot of idiots in the world that lack critical thinking.

Likewise I am sure some here see shades of brown and white (high relief) and instantly assume high mountain tops! Also when you squeeze an entire cross section of a province into a single image, especially a relatively flat one with slow gradual changes in elevation, well for those changes in elevation to be any larger than the width of a hair you need to do extreme vertical exaggerations.
__________________
Bridging the Gap
Check out my Flickr: https://www.flickr.com/photos/30634635@N03/with/29495547810/ and Youtube channel https://www.youtube.com/channel/UCV0_0h9qKlhxXFxuAey_q6Q
Reply With Quote
     
     
  #1079  
Old Posted Dec 21, 2020, 3:24 PM
Andy6's Avatar
Andy6 Andy6 is offline
Starring as himself
 
Join Date: Mar 2002
Location: Toronto Yorkville
Posts: 9,764
Quote:
Originally Posted by lio45 View Post
One of my pet peeves is maps where the color spectrum for the scale goes from one extreme color to another based only on the data range that's in the map itself. For example, a photovoltaic potential map of Nunavut where Ellesmere Island is dark blue and the southern area near the Manitoba border is bright red.

Elevation maps can easily fall into that trap. A PEI map could have the scale calibrated so 140 m is dark brown and sea level is green, and it would look like a very mountaineous island at first sight (until the viewer decides to look at the actual numbers and realizes a more correct map would have the entire island in green, with the scale used being a continent-wide one where the values in brown and beige are just absent from the island).
Why would you want a continent-wide scale when what you’re interested in is local variations in PEI? They’re not drawing these things with SSP “My province is the bumpiest!” bragging threads as the #1 use case.
__________________
crispy crunchy light and snappy
Reply With Quote
     
     
  #1080  
Old Posted Dec 21, 2020, 3:37 PM
VANRIDERFAN's Avatar
VANRIDERFAN VANRIDERFAN is offline
Registered User
 
Join Date: Jan 2007
Location: Regina
Posts: 5,484
Quote:
Originally Posted by Metro-One View Post
I do hope that everyone here realizes that you are all comparing / displaying maps with completely different color gradients and vertical exaggerations.

That horizontal view of Manitoba is using a vertical exaggeration of 100X!

For example you can make Florida look like the Rocky Mountains if you give each metre of elevation a different color representation and or an extreme vertical exaggeration.
You wouldn't want those stinkin hillbillies of fly-over country think that they have anything that compares with the majesty of the Coastal Mountain Range! The gall!!!
Reply With Quote
     
     
This discussion thread continues

Use the page links to the lower-right to go to the next page for additional posts
 
 
Reply

Go Back   SkyscraperPage Forum > Regional Sections > Canada
Forum Jump


Forum Jump


All times are GMT. The time now is 8:50 AM.


Powered by vBulletin® Version 3.8.7
Copyright ©2000 - 2026, vBulletin Solutions, Inc.