HomeDiagramsDatabaseMapsForum About
     

Go Back   SkyscraperPage Forum > Regional Sections > Canada


Reply

 
Thread Tools Display Modes
     
     
  #821  
Old Posted Jul 31, 2020, 8:12 PM
SaskScraper's Avatar
SaskScraper SaskScraper is offline
Registered User
 
Join Date: Mar 2012
Location: Saskatoon/London
Posts: 2,359
Quote:
Originally Posted by wave46 View Post
Kelowna's at ~350m. Kamloops is similar. Prince George is ~575m. Fort St. John is at ~690m.
Saskatoon is at 481 meters elevation
and Regina is at 577 meters, almost at exactly the same elevation as Prince George. Which makes anything above 1300 meters in either of the two provinces seem rather high in elevation as compared to valley bottoms or the Plains below.
Reply With Quote
     
     
  #822  
Old Posted Jul 31, 2020, 8:55 PM
le calmar's Avatar
le calmar le calmar is offline
Registered User
 
Join Date: Dec 2006
Location: Ottawa
Posts: 5,240
Quote:
Originally Posted by Acajack View Post
Going full circle (bouclons la boucle), Fermont is actually pretty "high", at over 600 m.
So that would make it one of the cities with the highest elevation in the province, but it looks rather flat. Prominence is more telling than elevation when it comes to determine the “wow factor” of a mountain imo. Those hills behind Fermont probably have an elevation of 700 m but they look like baby hills with a prominence of 100 m.
Reply With Quote
     
     
  #823  
Old Posted Jul 31, 2020, 9:11 PM
lio45 lio45 is offline
BANNED
 
Join Date: Aug 2007
Location: Quebec
Posts: 44,901
Exactly.

I'm pretty familiar with Amarillo, Texas (in the "high plains"). I just looked the elevation just for fun: 1100m! And plenty of areas around that city are prairie as flat as a sheet of paper, as far as the eye can see.

Having just crossed the BC interior, Rockies, Alberta, Saskatchewan, in a row, I can tell you that while SK isn't perfectly flat (the flattest I've seen along the TCH was Manitoba, I'd say the area before and near Winnipeg), it's still pretty damn flat. There are elevation changes, sure, but they're spread over large-ish distances.
Reply With Quote
     
     
  #824  
Old Posted Jul 31, 2020, 10:08 PM
GreaterMontréal's Avatar
GreaterMontréal GreaterMontréal is offline
Registered User
 
Join Date: Dec 2013
Posts: 4,628
Quote:
Originally Posted by SaskScraper View Post

Since I'm on this thread, another couple maps...

Population Density map of Canada.

Something I've never really thought of before is how Saskatchewan's main population is spread diagonally across the province from SouthEast to NorthWest, in the same angle as Saskatoon/Regina vector.
Where as Alberta's is vertical from South to North, Calgary to Edmonton.


Subdivisions around Montréal are so tiny. There are about 1.1M people living on the North Shore (including Laval) and about 1.3M on the South Shore.
Reply With Quote
     
     
  #825  
Old Posted Jul 31, 2020, 10:14 PM
jamincan jamincan is offline
Registered User
 
Join Date: Jul 2020
Location: KW
Posts: 1,902
Quote:
Originally Posted by Dengler Avenue View Post
That's surprising. Even the Ontario portion of Canadian Shield only has a median height of 300 m (though the area around Ignace can get up to 500 m).
I wonder if it's related to the fact that the glaciers extended further south in the east and retreated from the west earlier. You can see that southern parts of the western provinces are subsiding while there is still significant rebound in the east.

Reply With Quote
     
     
  #826  
Old Posted Jul 31, 2020, 10:17 PM
Calgarian's Avatar
Calgarian Calgarian is offline
Registered User
 
Join Date: Jun 2006
Location: Calgary, AB
Posts: 25,067
What jumps out at me from that map is how sparsely populated BC is. Makes sense though, not many people live where there are big mountains, just in the valleys below.
__________________
Git'er done!
Reply With Quote
     
     
  #827  
Old Posted Jul 31, 2020, 11:00 PM
SaskScraper's Avatar
SaskScraper SaskScraper is offline
Registered User
 
Join Date: Mar 2012
Location: Saskatoon/London
Posts: 2,359
Quote:
Originally Posted by jamincan View Post
I wonder if it's related to the fact that the glaciers extended further south in the east and retreated from the west earlier. You can see that southern parts of the western provinces are subsiding while there is still significant rebound in the east.

That probably is the main reason, ice on the Southern Prairies would have been relatively thin as compared to down east, plus the fact any area covered with ice age glacier would have been scoured flat from the ice.
Cypress Hills in Saskatchewan and the extreme Southern part of foothills in Alberta was the only part of any Canadian Provinces not covered in ice during last ice age.


10,000 years ago BC, Ontario and Quebec were the only provinces still mostly covered in ice.


https://www.geocaching.com/geocache/GC31...uid=a09f5cbf-0a26-4678-8e47-1f11431d1833
Reply With Quote
     
     
  #828  
Old Posted Jul 31, 2020, 11:37 PM
wave46 wave46 is offline
Closed account
 
Join Date: Aug 2016
Posts: 3,875
I have a quibble with that population density map.

The upper bound of the grading is far too low and some areas far too large for useful comparison.

Toronto's density as per the map expands north past Barrie. That's not reality on the ground. The density drops off quickly north of Highway 7. It also looks as if Toronto is as densely populated as Regina. Again, not really.

Calgary and Edmonton are one homogeneous mass. You'd think it would be the equivalent of the Northeast megalopolis by that map. There's ~250km of sparsely populated farmland (fine, and Red Deer too) between those cities.

It does sort of give an idea of population density, but it definitely is skewed oddly.
Reply With Quote
     
     
  #829  
Old Posted Jul 31, 2020, 11:43 PM
jamincan jamincan is offline
Registered User
 
Join Date: Jul 2020
Location: KW
Posts: 1,902
Quote:
Originally Posted by wave46 View Post
I have a quibble with that population density map.
The main issue with the map is that it's not a population density map. It seems to be based on population of census divisions, but the area of census divisions is not consistent. If they want to show population distribution, map either the density of the census divisions, or do a dot density map.
Reply With Quote
     
     
  #830  
Old Posted Jul 31, 2020, 11:59 PM
Andy6's Avatar
Andy6 Andy6 is offline
Starring as himself
 
Join Date: Mar 2002
Location: Toronto Yorkville
Posts: 9,758
Quote:
Originally Posted by jamincan View Post
The main issue with the map is that it's not a population density map. It seems to be based on population of census divisions, but the area of census divisions is not consistent. If they want to show population distribution, map either the density of the census divisions, or do a dot density map.
It's very odd ... they colour in each census division to indicate its total population and then un-colour all the areas within the district that are basically unpopulated. So it is partly showing total population and partly showing one end of the density scale.
__________________
crispy crunchy light and snappy
Reply With Quote
     
     
  #831  
Old Posted Aug 1, 2020, 12:19 AM
MonctonRad's Avatar
MonctonRad MonctonRad is online now
Wildcats Rule!!
 
Join Date: Jun 2008
Location: Moncton NB
Posts: 40,893
Quote:
Originally Posted by jamincan View Post
The main issue with the map is that it's not a population density map. It seems to be based on population of census divisions, but the area of census divisions is not consistent. If they want to show population distribution, map either the density of the census divisions, or do a dot density map.
Agreed. There used to be an interactive census dot map for all of North America on the web. Sadly it is no longer available. I did find one screen grab of a map of North America however:

__________________
Go 'Cats Go
Reply With Quote
     
     
  #832  
Old Posted Aug 1, 2020, 12:21 AM
wave46 wave46 is offline
Closed account
 
Join Date: Aug 2016
Posts: 3,875
Quote:
Originally Posted by jamincan View Post
The main issue with the map is that it's not a population density map. It seems to be based on population of census divisions, but the area of census divisions is not consistent. If they want to show population distribution, map either the density of the census divisions, or do a dot density map.
You're correct.

It still has a weirdly low upper bound. Canada has census divisions of 500k, 1 million and 2 million. It just seems bizarre to lump them in together, as if lumping in people with annual incomes of $55,000 with multi-millionaires into the same batch and calling them all 'rich'.
Reply With Quote
     
     
  #833  
Old Posted Aug 1, 2020, 12:24 AM
MonctonRad's Avatar
MonctonRad MonctonRad is online now
Wildcats Rule!!
 
Join Date: Jun 2008
Location: Moncton NB
Posts: 40,893
Quote:
Originally Posted by wave46 View Post
You're correct.

It still has a weirdly low upper bound. Canada has census divisions of 500k, 1 million and 2 million. It just seems bizarre to lump them in together, as if lumping in people with annual incomes of $55,000 with multi-millionaires into the same batch and calling them all 'rich'.
The people who hate the 1%ers do just that. 90% of the 1%ers are simply upper middle class, yet they are lumped in with the tech billionaires..........
__________________
Go 'Cats Go
Reply With Quote
     
     
  #834  
Old Posted Aug 1, 2020, 12:59 AM
isaidso isaidso is online now
North of Gilead
 
Join Date: Dec 2008
Location: North of Gilead
Posts: 11,056
Quote:
Originally Posted by lio45 View Post
Do you know where the fuck this town is? It's in remote Northern Quebec. That's like me using Uranium City weather data for "Saskatchewan" (and bolding it).
Except he didn't use Fermont as a representation of Quebec weather. And this is a public forum.... leave the trashy language/behaviour at home.
__________________
ELBOWS UP CANADA, ELBOWS UP UKRAINE, ELBOWS UP GREENLAND
CANADA, EUROPE, NZ, AUSTRALIA, JAPAN, MEXICO STRONG

US REPUBLICANS/MAGA/ICE NOT WELCOME HERE, STAY OUT
Reply With Quote
     
     
  #835  
Old Posted Aug 1, 2020, 1:08 AM
isaidso isaidso is online now
North of Gilead
 
Join Date: Dec 2008
Location: North of Gilead
Posts: 11,056
Quote:
Originally Posted by SaskScraper View Post

Population Density map of Canada.

Something I've never really thought of before is how Saskatchewan's main population is spread diagonally across the province from SouthEast to NorthWest, in the same angle as Saskatoon/Regina vector.
Where as Alberta's is vertical from South to North, Calgary to Edmonton.

That southeast to northwest population vector actually starts in Kenora, Ontario and continues in a fairly straight line through the prairie all the way to Dawson Creek, BC.
__________________
ELBOWS UP CANADA, ELBOWS UP UKRAINE, ELBOWS UP GREENLAND
CANADA, EUROPE, NZ, AUSTRALIA, JAPAN, MEXICO STRONG

US REPUBLICANS/MAGA/ICE NOT WELCOME HERE, STAY OUT
Reply With Quote
     
     
  #836  
Old Posted Aug 1, 2020, 1:35 AM
Denscity Denscity is offline
Registered User
 
Join Date: Jun 2008
Location: Laramidia
Posts: 12,763
Quote:
Originally Posted by isaidso View Post
That southeast to northwest population vector actually starts in Kenora, Ontario and continues in a fairly straight line through the prairie all the way to Dawson Creek, BC.
And Dawson Creek is lso Prairie. A lesser mentioned part of BC.
__________________
Peak SSP:

28C is hotter than 42C
Vancouver is not on the ocean but Quebec City is.
Reply With Quote
     
     
  #837  
Old Posted Aug 1, 2020, 4:03 PM
SaskScraper's Avatar
SaskScraper SaskScraper is offline
Registered User
 
Join Date: Mar 2012
Location: Saskatoon/London
Posts: 2,359
Quote:
Originally Posted by isaidso View Post
Except he didn't use Fermont as a representation of Quebec weather. And this is a public forum.... leave the trashy language/behaviour at home.

thank's isaidso, I appreciate you reining in some of the trash talk on this thread.

I also found out from private message that he was my hometown stalker from earlier in the week apparently


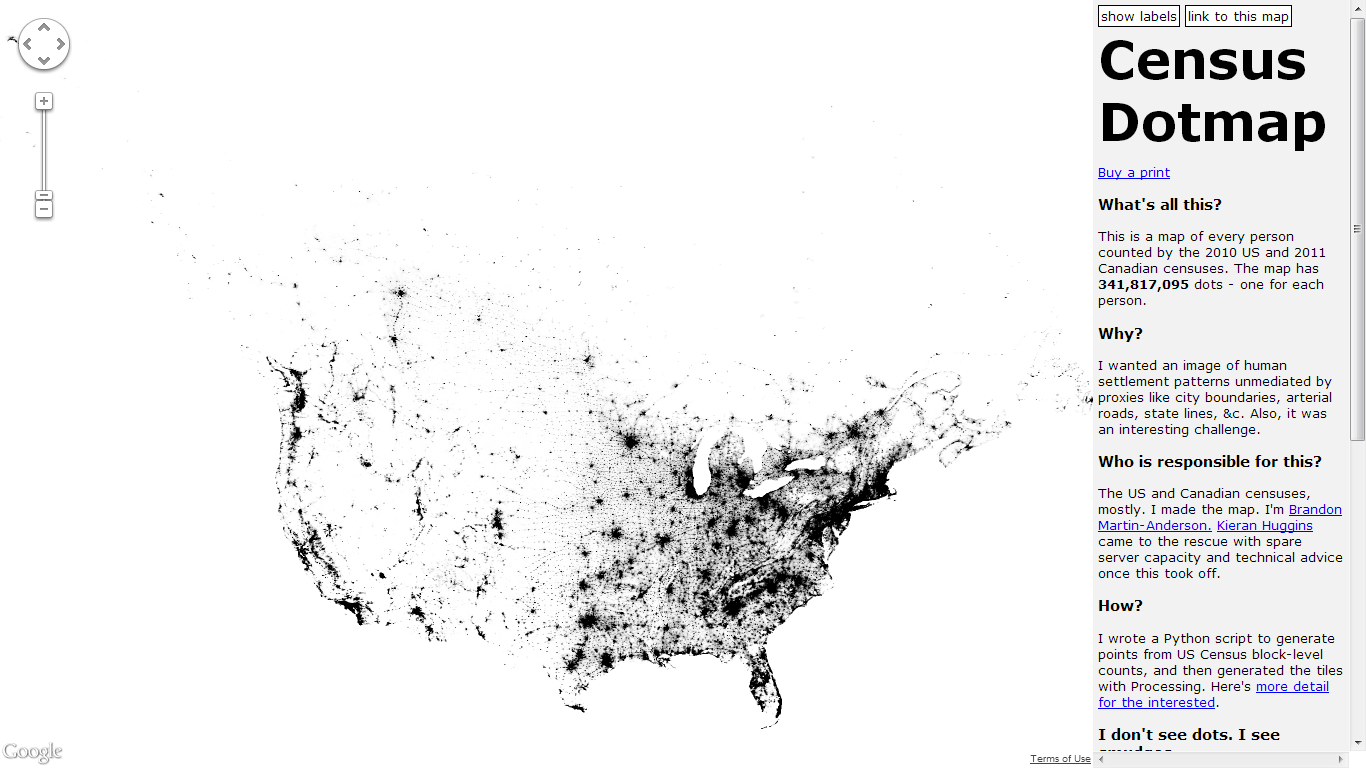
That Census Dotmap of North America is interesting, gives the impression that Minneapolis is more populous than LA & San Diego combined,
and Salt Lake City has just as many people as Miami, who knew
Reply With Quote
     
     
  #838  
Old Posted Aug 1, 2020, 5:04 PM
MolsonExport's Avatar
MolsonExport MolsonExport is online now
Pass me the Vomit Bag.
 
Join Date: Oct 2003
Location: Otisburgh
Posts: 50,939
I am finding it extremely hard to swallow that someone would actually feel it necessary to "warn you" about Lio passing through Saskatchewan. I mean, I believe that someone sent you that PM, but I cannot for the life of me understand how someone could ever think that Lio could represent a threat in such a manner. And moreover, I am shocked at how poor that person's grammar is.
Reply With Quote
     
     
  #839  
Old Posted Aug 1, 2020, 5:11 PM
MonkeyRonin's Avatar
MonkeyRonin MonkeyRonin is offline
¥ ¥ ¥
 
Join Date: Sep 2006
Location: Vancouver
Posts: 10,594
Who knew that passing through a city was stalking... Good thing Lio didn't stop in Toronto on his drive across the country - wouldn't want to have to worry about a "stocker" here!
__________________
Reply With Quote
     
     
  #840  
Old Posted Aug 1, 2020, 5:16 PM
lio45 lio45 is offline
BANNED
 
Join Date: Aug 2007
Location: Quebec
Posts: 44,901
I was actually pretty kind to your hometown, all things considered.

Trust me, you don't want to hear what MolsonEx (or, more generally, all the SSPers active in the Soul-Sucking Buildings thread) would have to say about, for example, this section of Jasper Street:

https://www.google.com/maps/@49.9082984,...6RmOr5zw8mfaqLUAGhtBg!2e0!7i13312!8i6656


... maybe you're better off having everyone on ignore, in the end
Reply With Quote
     
     
This discussion thread continues

Use the page links to the lower-right to go to the next page for additional posts
 
 
Reply

Go Back   SkyscraperPage Forum > Regional Sections > Canada
Forum Jump


Forum Jump


All times are GMT. The time now is 8:50 PM.

     
SkyscraperPage.com - Privacy Statement - Top

Powered by vBulletin® Version 3.8.7
Copyright ©2000 - 2026, vBulletin Solutions, Inc.