HomeDiagramsDatabaseMapsForum About
     

Go Back   SkyscraperPage Forum > Discussion Forums > City Discussions


Reply

 
Thread Tools Display Modes
     
     
  #121  
Old Posted Oct 13, 2018, 1:31 AM
Capsicum's Avatar
Capsicum Capsicum is offline
Registered User
 
Join Date: Sep 2017
Location: Western Hemisphere
Posts: 2,489
Quote:
Originally Posted by Urbanguy View Post
According to the US Census: Foreign-born immigrants are foreign-born people whose usual place of residence is in the United States. So yes, if their usual place of residence is in the US. If it’s only part of the year (or below a certain threshold) then not necessarily so. A place like Miami attracts a lot of wealthy temporary/part time residents.
Seems like the US has a broader definition of "immigrant" than Canada.

Basically a foreign-born person who's a resident, regardless of if they're on any visa status, citizen or not, or even if they have any intention to stay or pursue a path to citizenship (So, what one might consider expats in some other country, like Brits living but vacationing in Spain or Western countries' citizens as expats in Thailand, would be considered "immigrants" stateside, like Canadians vacationing in their Phoenix home with no intention of becoming American citizens).

Canada's definition of immigrant is a permanent resident in Canada, so like (I think) a US green card holder?

Otherwise, those on other temporary visa statuses are not called immigrants in Canada but non-permanent residents.

From Stats Canada:

https://www12.statcan.gc.ca/nhs-enm/2011/ref/dict/pop148-eng.cfm

"Immigrant refers to a person who is or has ever been a landed immigrant/permanent resident. This person has been granted the right to live in Canada permanently by immigration authorities."


"Non-permanent resident refers to a person from another country who has a work or study permit or who is a refugee claimant, and any non-Canadian-born family member living in Canada with them."
Reply With Quote
     
     
  #122  
Old Posted Oct 13, 2018, 1:34 AM
Capsicum's Avatar
Capsicum Capsicum is offline
Registered User
 
Join Date: Sep 2017
Location: Western Hemisphere
Posts: 2,489
It's notable to me that people often use "immigrant" very variably in various contexts.

As a Canadian that came to the US for schooling and work, I still recall receiving my student visa status to live stateside having a status as being a "Non-immigrant visa", implying that international students are not considered "immigrants". Work visas likewise.
Reply With Quote
     
     
  #123  
Old Posted Oct 13, 2018, 3:55 AM
Urbanguy's Avatar
Urbanguy Urbanguy is offline
Go Beavs! Go Niners!
 
Join Date: Dec 2001
Location: Portland | Honolulu
Posts: 6,195
Quote:
Originally Posted by Capsicum View Post
Seems like the US has a broader definition of "immigrant" than Canada.

Basically a foreign-born person who's a resident, regardless of if they're on any visa status, citizen or not, or even if they have any intention to stay or pursue a path to citizenship (So, what one might consider expats in some other country, like Brits living but vacationing in Spain or Western countries' citizens as expats in Thailand, would be considered "immigrants" stateside, like Canadians vacationing in their Phoenix home with no intention of becoming American citizens).

Canada's definition of immigrant is a permanent resident in Canada, so like (I think) a US green card holder?

Otherwise, those on other temporary visa statuses are not called immigrants in Canada but non-permanent residents.

From Stats Canada:

https://www12.statcan.gc.ca/nhs-enm/2011/ref/dict/pop148-eng.cfm

"Immigrant refers to a person who is or has ever been a landed immigrant/permanent resident. This person has been granted the right to live in Canada permanently by immigration authorities."


"Non-permanent resident refers to a person from another country who has a work or study permit or who is a refugee claimant, and any non-Canadian-born family member living in Canada with them."
I think there may be a misunderstanding -- the US Census uses the term foreign-born to basically mean anyone that wasn't born a U.S. Citizen and they aren't counted among the foreign-born immigrant population unless their usual place of residence is in the United States (meaning they live here at least full time like a non-U.S. Citizen who is awaiting/applying for permanent resident status, for example, to which their status would change and they'd become a "Naturalized" U.S. Citizen), yet remain foreign-born because they weren't born in the United States or any of it's territories, commonwealths or former zones (think Panama Canal Zone, former US Senator John McCain is a good example), former territories (Philippines between 1898-1946), children born to American Soldiers (like in Vietnam, where they are termed "Amerasians" and can migrate to the US bypassing the traditional immigration process), etc.
Reply With Quote
     
     
  #124  
Old Posted Oct 13, 2018, 4:04 AM
Urbanguy's Avatar
Urbanguy Urbanguy is offline
Go Beavs! Go Niners!
 
Join Date: Dec 2001
Location: Portland | Honolulu
Posts: 6,195
Also, i'll give you a couple of examples of Europe, namely Eastern Europe being represented in the Top source countries of immigrants to NYC which continued up until at least the early 2000's. The shift and trends you're seeing now with European countries ranking lower are fairly recent.

New York, NY M.S.A. 2000
1 DominicanRepublic 7,835
2 China, People's Republic 7,703
3 Jamaica 5,072
4 Haiti 4,351
5 Ukraine 3,600
6 Bangladesh 3,255
7 Pakistan 3,069
8 Ecuador 3,042
9 India 2,409
10 Russia 2,360
...12 Poland 1,726

New York, NY M.S.A. 2001
1 Dominican Republic 9,787
2 China, People's Republic 6,862
3 Jamaica 5,059
4 Haiti 3,887
5 Ecuador 3,665
6 India 3,156
7 Ukraine 3,020
8 Pakistan 2,677
9 Russia 2,339
10 Colombia 2,066
11 Poland 1,935

Last edited by Urbanguy; Oct 13, 2018 at 4:26 AM.
Reply With Quote
     
     
  #125  
Old Posted Oct 13, 2018, 4:42 AM
Urbanguy's Avatar
Urbanguy Urbanguy is offline
Go Beavs! Go Niners!
 
Join Date: Dec 2001
Location: Portland | Honolulu
Posts: 6,195
...and now we travel to the Rockies of the U.S. to...


Image Source: panoramaproperty.com

Top 50 Non-United States countries or places of birth
*Puerto Rico included in Top 50 (but not considered foreign-born)

Denver, United States 2017

1 México (Estados Unidos Mexicanos) 169,332
2 India (Bhārat) 19,279
3 China, People's Republic of 16,345
4 Vietnam (Việt Nam), Socialist Republic of 16,263
5 Ethiopia 12,023
6 United Kingdom 10,747
7 Canada 9,331
8 Germany (Deutschland) 8,619
9 Korea, Republic of (South) 7,614
10 Philippines (Pilipinas), Republic of the 6,667

11 El Salvador 5,432
12 Puerto Rico 5,073
13 Russian Federation (Russia) 4,971
14 Nepal 4,338
15 Perú 4,027
16 Guatemala 3,941
17 Myanmar (Burma) 3,932
18 Japan 3,526
19 Poland (Polska) 3,360
20 Colombia 3,314

21 Ukraine 3,272
22 Iran, Islamic Republic of 3,198
23 Thailand 3,027
24 Iraq 2,824
25 Ghana 2,724
26 Pakistan 2,627
27 Taiwan 2,460
28 Haïti 2,455
29 Lao People's Democratic Republic (Laos) 2,447
30 Honduras 2,392

31 Cuba 2,146
32 Nigeria 2,063
33 Australia 1,870
34 South Africa, Republic of 1,846
35 Malaysia 1,749
36 France 1,574
37 Cambodia (Kampuchea) 1,527
38 Chile 1,433
39 Bosnia and Herzegovina 1,374
40 Brasil 1,346

41 Morocco (Al Maghrib) 1,338
42 Somalia 1,305
43 Jamaica 1,244
44 Romania (România) 1,242
45 Czechoslovakia, former 1,189
46 Eritrea (Ertra) 1,165
47 Saudi Arabia 1,098
48 Israel (Yisra'el) 1,086
49 Afghanistan, Islamic Republic of 1,043
50 Lebanese Republic (Lebanon) 1,029

Total Foreign-born: 416,606
CSA Population: 3,515,374

U.S. Island Areas (Guam, USVI, American Samoa, CNMI) 1,000

Top 40 newly added legal permanent residents by country of birth

Denver-Aurora-Lakewood, CO 2017

1 Mexico 2,720
2 Ethiopia 656
3 Vietnam 460
4 China, People's Republic 332
5 India 317
6 Nepal 299
7 Iraq 289
8 Afghanistan 279
9 Burma 260
10 Congo, Democratic Republic 169

11 Korea, South 161
12 Ghana 142
13 Philippines 142
14 Russia 131
15 Ukraine 126
16 Canada 125
17 El Salvador 120
18 United Kingdom 120
19 Sudan 106
20 Cuba 96

21 Iran 96
22 Malaysia 84
23 Peru 84
24 Bhutan 78
25 Thailand 77
26 Morocco 73
27 Colombia 70
28 Somalia 67
29 Brazil 64
30 Honduras 62

31 South Africa 61
32 Uganda 61
33 Australia 59
34 Eritrea 59
35 Guatemala 56
36 Nigeria 55
37 Pakistan 55
38 Belarus 47
39 Mongolia 46
40 Venezuela 45

Total CBSA/MSA or Combined Tallied & Represented of CSA above: 9,798
Total CSA or MSA Legal Permanent Residents: 11,561
Total Legal Permanent Residents by Country of Birth
Source: U.S. Department of Homeland Security.

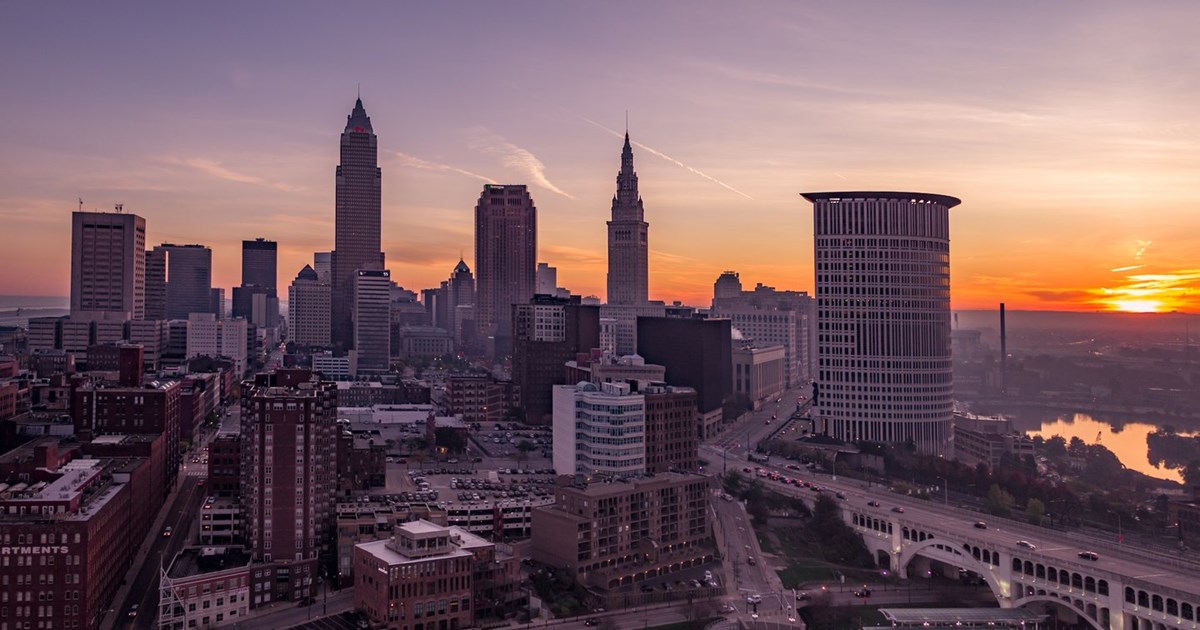
...East we go back to the Great Lakes to...


Image Source: thisiscleveland.com

Top 50 Non-United States countries or places of birth
*Puerto Rico included in Top 50 (but not considered foreign-born)

Cleveland, United States 2017

1 Puerto Rico 25,465
2 India (Bhārat) 15,621
3 México (Estados Unidos Mexicanos) 11,266
4 China, People's Republic of 8,802
5 Ukraine 7,547
6 Germany (Deutschland) 7,484
7 Italy (Italia) 5,017
8 Philippines (Pilipinas), Republic of the 4,912
9 Russian Federation (Russia) 4,893
10 Canada 4,758

11 United Kingdom 4,076
12 Romania (România) 4,045
13 Poland (Polska) 3,363
14 Vietnam (Việt Nam), Socialist Republic of 3,361
15 Dominican Republic (República Dominicana) 3,085
16 Jamaica 2,562
17 Nepal 2,490
18 Korea, Republic of (South) 2,267
19 Perú 2,178
20 Bosnia and Herzegovina 2,076

21 Hungary (Magyarország) 2,050
22 Myanmar (Burma) 1,858
23 Croatia (Hrvatska) 1,830
24 Japan 1,738
25 Greece (Hellenic Republic) 1,610
26 Albania (Shqiperia) 1,594
27 Guatemala 1,562
28 Syrian Arab Republic (Syria) 1,541
29 Lebanese Republic (Lebanon) 1,442
30 Colombia 1,425

31 Serbia (Srbija) 1,376
32 Saudi Arabia 1,239
33 Thailand 1,215
34 Guyana 1,194
35 Israel (Yisra'el) 1,188
36 Nigeria 1,181
37 Iran, Islamic Republic of 1,170
38 Sudan 1,099
39 Ghana 1,089
40 Egypt, Arab Republic of 1,016

41 Czechoslovakia, former 1,011
42 Lao People's Democratic Republic (Laos) 964
43 China, Hong Kong (Special Administrative Region) 960
44 Turkey (Türkiye) 909
45 El Salvador 856
46 Ireland, Republic of (Éire) 808
47 South Africa, Republic of 779
48 Taiwan 758
49 Lithuania (Lietuva) 726
50 Honduras 702

Total Foreign-born: 167,289
CSA Population: 3,485,691

U.S. Island Areas (Guam, USVI, American Samoa, CNMI) 608

There are many U.S. metros that have seen an increase with their immigrant populations that are beyond the historical immigrant hubs but there are many other's that have not experienced their "fair" share (relatively speaking) like Cleveland, Cincy & Pittsburgh, for example. It's unfortunate in my opinion and though it doesn't make them any less great it just seems like an anomaly when compared to other metros that are much smaller and receive much more.


Top 40 newly added legal permanent residents by country of birth

Cleveland-Elyria, OH 2017

1 India 268
2 China, People's Republic 177
3 Ukraine 148
4 Mexico 147
5 Syria 115
6 Albania 94
7 Iraq 89
8 Philippines 85
9 Afghanistan 84
10 Vietnam 79

11 Bhutan 78
12 Nepal 78
13 Egypt 76
14 Jordan 67
15 Dominican Republic 65
16 Congo, Democratic Republic 61
17 Jamaica 61
18 Cote d'Ivoire 52
19 Korea, South 51
20 Nigeria 46

21 Canada 43
22 United Kingdom 38
23 Pakistan 35
24 Romania 35
25 Uzbekistan 35
26 Iran 32
27 Israel 31
28 Russia 31
29 Lebanon 30
30 El Salvador 28

31 Sudan 28
32 Uganda 27
33 Turkey 23
34 Saudi Arabia 22
35 Peru 21
36 Guyana 20
37 Burma 19
38 Ghana 19
39 Moldova 18
40 Morocco 18

Total CBSA/MSA or Combined Tallied & Represented of CSA above: 3,091
Total CSA or MSA Legal Permanent Residents: 4,654
Total Legal Permanent Residents by Country of Birth
Source: U.S. Department of Homeland Security.

...back to the West Coast we go to a city -- that, in my opinion, has one of the best climates...it also happens to have a surprisingly large Iraq-born population -- the 2nd largest in the U.S. and 3rd largest in all of the America's behind Detroit & Toronto...


Image Source: cbre.cdnist.com

Top 50 Non-United States countries or places of birth
*Puerto Rico included in Top 50 (but not considered foreign-born)

San Diego, United States 2017

1 México (Estados Unidos Mexicanos) 335,820
2 Philippines (Pilipinas), Republic of the 94,084
3 Vietnam (Việt Nam), Socialist Republic of 37,409
4 China, People's Republic of 28,637
5 India (Bhārat) 27,430
6 Iraq 22,890
7 Korea, Republic of (South) 16,151
8 Iran, Islamic Republic of 13,705
9 Japan 13,558
10 Canada 13,302

11 United Kingdom 13,061
12 Taiwan 10,427
13 Guatemala 7,415
14 Germany (Deutschland) 7,026
15 Russian Federation (Russia) 6,617
16 Brasil 6,178
17 El Salvador 4,794
18 Italy (Italia) 4,765
19 Puerto Rico 4,649
20 Afghanistan, Islamic Republic of 4,312

21 Ukraine 3,909
22 Colombia 3,729
23 Thailand 3,716
24 Lao People's Democratic Republic (Laos) 3,667
25 Israel (Yisra'el) 3,524
26 France 3,082
27 Perú 2,992
28 Poland (Polska) 2,912
29 Lebanese Republic (Lebanon) 2,759
30 Portugal 2,693

31 Cambodia (Kampuchea) 2,599
32 Ethiopia 2,159
33 China, Hong Kong (Special Administrative Region) 2,137
34 Somalia 2,018
35 South Africa, Republic of 1,949
36 Indonesia 1,939
37 Honduras 1,901
38 Australia 1,874
39 Argentine Republic (Argentina) 1,730
40 Denmark (Danmark) 1,669

41 Netherlands (Nederland) 1,638
42 Syrian Arab Republic (Syria) 1,569
43 Ecuador 1,538
44 Belgium, Kingdom of 1,522
45 Jamaica 1,390
46 Hungary (Magyarország) 1,357
47 Spain (España) 1,346
48 Ireland, Republic of (Éire) 1,315
49 Venezuela, Bolivarian Republic of 1,263
50 Dominican Republic (República Dominicana) 1,185

Total Foreign-born: 777,480
MSA Population: 3,337,685

U.S. Island Areas (Guam, USVI, American Samoa, CNMI) 5,597

Top 40 newly added legal permanent residents by country of birth

San Diego-Carlsbad, CA 2017

1 Mexico 7,197
2 Philippines 1,721
3 Iraq 1,111
4 Vietnam 915
5 China, People's Republic 819
6 Afghanistan 712
7 Iran 427
8 India 398
9 Korea, South 301
10 Brazil 242

11 Canada 197
12 Ethiopia 176
13 Guatemala 169
14 United Kingdom 167
15 Syria 152
16 Russia 139
17 Japan 123
18 Cuba 118
19 Somalia 107
20 Colombia 92

21 Taiwan 92
22 Ukraine 91
23 Turkey 90
24 Congo, Democratic Republic 89
25 France 87
26 Germany 80
27 Australia 77
28 Thailand 77
29 Jordan 72
30 Peru 72

31 Nigeria 67
32 Egypt 62
33 Israel 62
34 Cambodia 57
35 Italy 53
36 Pakistan 53
37 Honduras 51
38 Burma 50
39 El Salvador 50
40 Spain 48

Total CBSA/MSA or Combined Tallied & Represented of MSA above: 18,106
Total CSA or MSA Legal Permanent Residents: 18,106
Total Legal Permanent Residents by Country of Birth
Source: U.S. Department of Homeland Security.

...more to come...
Reply With Quote
     
     
  #126  
Old Posted Oct 13, 2018, 5:10 AM
Urbanguy's Avatar
Urbanguy Urbanguy is offline
Go Beavs! Go Niners!
 
Join Date: Dec 2001
Location: Portland | Honolulu
Posts: 6,195
...off we go to central Florida to the land of theme parks and fun for all...despite it's reputation as a place that attracts millions of tourists each year it's also a popular destination for immigrants and American born migrants to settle in.


Image Source: theapopkavoice.com

Top 50 Non-United States countries or places of birth
*Puerto Rico included in Top 50 (but not considered foreign-born)

Orlando, United States 2017

1 Puerto Rico 208,868
2 Haïti 46,464
3 Venezuela, Bolivarian Republic of 40,009
4 Colombia 33,565
5 Cuba 31,881
6 México (Estados Unidos Mexicanos) 30,263
7 Dominican Republic (República Dominicana) 27,446
8 Jamaica 27,386
9 Brasil 24,060
10 Guyana 15,878

11 Vietnam (Việt Nam), Socialist Republic of 14,610
12 India (Bhārat) 13,988
13 Philippines (Pilipinas), Republic of the 13,804
14 United Kingdom 12,874
15 China, People's Republic of 12,188
16 Canada 12,005
17 Perú 10,823
18 Trinidad and Tobago 10,383
19 Honduras 8,779
20 Germany (Deutschland) 7,330

21 Ecuador 7,070
22 Guatemala 6,640
23 Morocco (Al Maghrib) 6,121
24 Panamá 5,289
25 Nicaragua 5,218
26 Italy (Italia) 4,063
27 Korea, Republic of (South) 3,920
28 France 3,731
29 Argentine Republic (Argentina) 3,568
30 El Salvador 3,517

31 Russian Federation (Russia) 3,413
32 Pakistan 2,769
33 Romania (România) 2,723
34 Japan 2,691
35 Portugal 2,496
36 Costa Rica 2,364
37 Ukraine 2,288
38 Lebanese Republic (Lebanon) 2,265
39 Dominica (Waitikubuli) 2,088
40 Nigeria 1,889

41 Thailand 1,813
42 Egypt, Arab Republic of 1,747
43 Spain (España) 1,632
44 Poland (Polska) 1,484
45 Barbados 1,481
46 Taiwan 1,427
47 South Africa, Republic of 1,414
48 Turkey (Türkiye) 1,406
49 Lao People's Democratic Republic (Laos) 1,387
50 Israel (Yisra'el) 1,241

Total Foreign-born: 527,527
CSA Population: 3,284,198

U.S. Island Areas (Guam, USVI, American Samoa, CNMI) 9,212

Top 40 newly added legal permanent residents by country of birth

Orlando-Kissimmee-Sanford, FL 2017

1 Cuba 1,504
2 Haiti 1,308
3 Dominican Republic 943
4 Venezuela 856
5 Jamaica 789
6 Brazil 737
7 Colombia 698
8 Philippines 441
9 Mexico 440
10 India 332

11 Vietnam 305
12 China, People's Republic 269
13 United Kingdom 199
14 Morocco 188
15 Peru 170
16 Ecuador 168
17 Guyana 139
18 Honduras 139
19 Egypt 125
20 Canada 124

21 Pakistan 111
22 Moldova 107
23 El Salvador 88
24 Kenya 84
25 Bangladesh 80
26 Iraq 78
27 Russia 71
28 Guatemala 70
29 Nigeria 68
30 Argentina 63

31 Trinidad and Tobago 61
32 Ukraine 61
33 France 59
34 Iran 53
35 Spain 50
36 Germany 48
37 Korea, South 48
38 Congo, Democratic Republic 43
39 Nicaragua 43
40 Panama 43

Total CBSA/MSA or Combined Tallied & Represented of CSA above: 12,379
Total CSA or MSA Legal Permanent Residents: 13,391
Total Legal Permanent Residents by Country of Birth
Source: U.S. Department of Homeland Security.

...after a brief stop in O-town off we go back to the Northwest U.S. to the city where I currently reside...


Image Source: photofocus.com

Top 50 Non-United States countries or places of birth
*Puerto Rico included in Top 50 (but not considered foreign-born)

Portland, United States 2017

1 México (Estados Unidos Mexicanos) 112,058
2 Vietnam (Việt Nam), Socialist Republic of 24,062
3 China, People's Republic of 19,718
4 India (Bhārat) 19,109
5 Philippines (Pilipinas), Republic of the 13,364
6 Korea, Republic of (South) 12,090
7 Ukraine 12,075
8 Canada 11,113
9 United Kingdom 9,645
10 Russian Federation (Russia) 9,549

11 Japan 7,072
12 Germany (Deutschland) 5,860
13 Guatemala 5,605
14 Iran, Islamic Republic of 5,190
15 Romania (România) 4,955
16 Ethiopia 4,751
17 Thailand 4,326
18 El Salvador 3,982
19 Cuba 3,884
20 Taiwan 3,713

21 Lao People's Democratic Republic (Laos) 3,114
22 China, Hong Kong (Special Administrative Region) 2,784
23 Moldova, Republic of 2,751
24 Cambodia (Kampuchea) 2,528
25 Puerto Rico 2,408
26 Fiji Islands 2,322
27 France 2,172
28 Egypt, Arab Republic of 2,139
29 Brasil 2,022
30 Netherlands (Nederland) 1,977

31 Somalia 1,777
32 Belarus 1,767
33 Venezuela, Bolivarian Republic of 1,744
34 Myanmar (Burma) 1,730
35 Lebanese Republic (Lebanon) 1,729
36 Bosnia and Herzegovina 1,705
37 Perú 1,591
38 Bangladesh 1,505
39 Iraq 1,482
40 Australia 1,334

41 Indonesia 1,279
42 Pakistan 1,269
43 Colombia 1,215
44 Chile 1,190
45 Kazakhstan (Qazaqstan) 1,184
46 Norway (Norge) 1,101
47 Czechoslovakia, former 1,081
48 Armenia (Hayastan) 973
49 Ireland, Republic of (Éire) 960
50 Israel (Yisra'el) 942

Total Foreign-born: 375,167
CSA Population: 3,199,450

U.S. Island Areas (Guam, USVI, American Samoa, CNMI) 7,006

Portland-Vancouver-Hillsboro, OR-WA 2017

1 Mexico 1,488
2 Vietnam 595
3 China, People's Republic 520
4 Ukraine 389
5 India 317
6 Philippines 271
7 Cuba 237
8 Iraq 210
9 Burma 182
10 Ethiopia 159

11 Guatemala 158
12 Afghanistan 155
13 Iran 148
14 Russia 146
15 Korea, South 131
16 Somalia 121
17 Canada 118
18 Thailand 111
19 United Kingdom 101
20 Taiwan 81

21 Nepal 78
22 Kenya 73
23 Moldova 72
24 Malaysia 71
25 Japan 60
26 Romania 56
27 El Salvador 51
28 Brazil 47
29 Bangladesh 46
30 Egypt 45

31 Syria 44
32 Australia 43
33 France 42
34 Nigeria 41
35 Cambodia 40
36 Bhutan 39
37 Germany 39
38 Argentina 36
39 Colombia 35
40 Israel 35

Total CBSA/MSA or Combined Tallied & Represented of CSA above: 7,741
Total CSA or MSA Legal Permanent Residents: 8,873
Total Legal Permanent Residents by Country of Birth
Source: U.S. Department of Homeland Security.

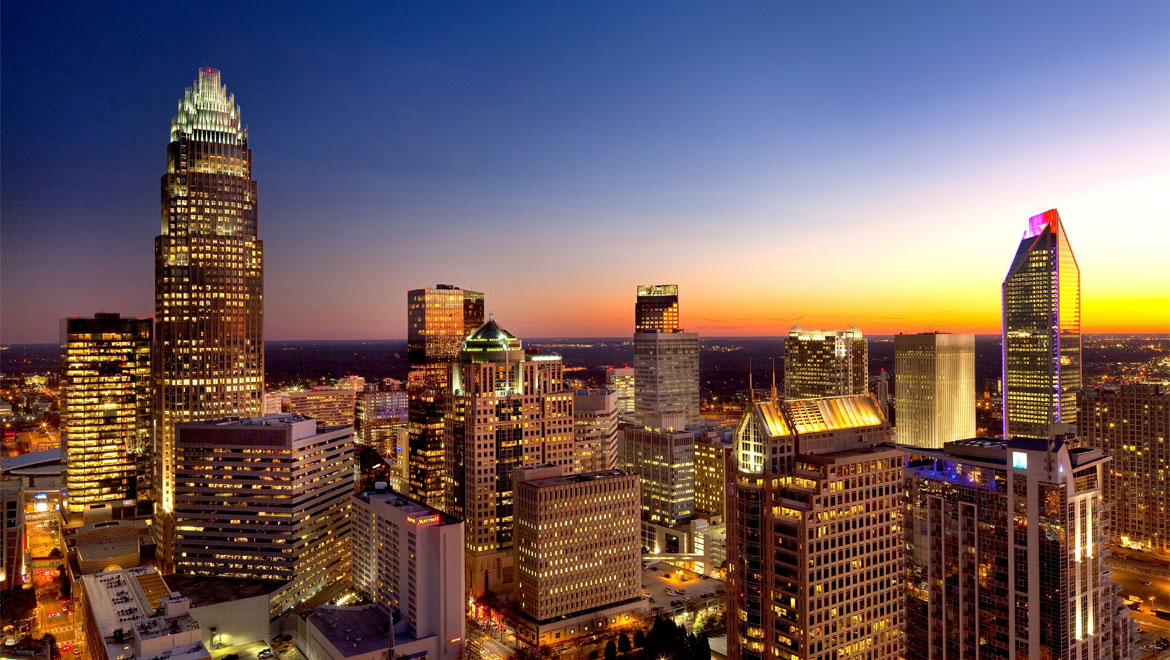
After a few beers in the Brewery Blocks we take a flight back down South to the "Queen City"...


Image Source: omnihotels.com

Top 50 Non-United States countries or places of birth
*Puerto Rico included in Top 50 (but not considered foreign-born)

Charlotte, United States 2017

1 México (Estados Unidos Mexicanos) 54,655
2 India (Bhārat) 31,189
3 Honduras 15,229
4 El Salvador 10,294
5 Vietnam (Việt Nam), Socialist Republic of 10,126
6 Colombia 9,208
7 Puerto Rico 8,149
8 Guatemala 6,533
9 United Kingdom 6,198
10 China, People's Republic of 5,699

11 Germany (Deutschland) 5,093
12 Canada 4,933
13 Cuba 4,812
14 Perú 4,439
15 Brasil 4,408
16 Philippines (Pilipinas), Republic of the 3,867
17 Lao People's Democratic Republic (Laos) 3,557
18 Dominican Republic (República Dominicana) 3,163
19 Jamaica 2,944
20 Korea, Republic of (South) 2,538

21 Nicaragua 2,536
22 Ukraine 2,480
23 Venezuela, Bolivarian Republic of 2,245
24 Russian Federation (Russia) 2,039
25 Nigeria 1,963
26 Italy (Italia) 1,933
27 Ghana 1,754
28 Cambodia (Kampuchea) 1,671
29 Thailand 1,612
30 Myanmar (Burma) 1,547

31 Japan 1,494
32 Iran, Islamic Republic of 1,476
33 Bosnia and Herzegovina 1,439
34 Morocco (Al Maghrib) 1,390
35 Guyana 1,378
36 Costa Rica 1,313
37 Ethiopia 1,193
38 Sudan 1,174
39 Ecuador 1,140
40 Romania (România) 1,118

41 Haïti 1,109
42 Liberia 1,097
43 Greece (Hellenic Republic) 1,073
44 South Africa, Republic of 1,036
45 Nepal 1,004
46 Poland (Polska) 993
47 Iraq 977
48 Bangladesh 917
49 Jordan (Al Urdun) 879
50 Eritrea (Ertra) 831

Total Foreign-born: 262,547
CSA Population: 2,684,121

U.S. Island Areas (Guam, USVI, American Samoa, CNMI) 491

Top 40 newly added legal permanent residents by country of birth

Charlotte-Concord-Gastonia, NC-SC 2017

1 Mexico 1,064
2 India 642
3 Vietnam 264
4 Burma 243
5 El Salvador 234
6 Colombia 221
7 China, People's Republic 212
8 Dominican Republic 205
9 Honduras 200
10 Congo, Democratic Republic 185

11 Philippines 178
12 Cuba 155
13 Ecuador 134
14 Liberia 107
15 United Kingdom 106
16 Nepal 103
17 Peru 92
18 Ukraine 91
19 Bhutan 89
20 Canada 88

21 Brazil 85
22 Ethiopia 81
23 Venezuela 80
24 Guatemala 79
25 Jamaica 79
26 Russia 72
27 Malaysia 65
28 Pakistan 64
29 Eritrea 63
30 Ghana 62

31 Nigeria 61
32 South Africa 55
33 Iran 52
34 Costa Rica 50
35 Korea, South 50
36 Iraq 41
37 Jordan 39
38 France 36
39 Egypt 35
40 Germany 35

Total CBSA/MSA or Combined Tallied & Represented of CSA above: 6,811
Total CSA or MSA Legal Permanent Residents: 6,901
Total Legal Permanent Residents by Country of Birth
Source: U.S. Department of Homeland Security.

Next up is Steel City USA and one of my favorite skylines (I have many but this is definitely one of them) and well the Steeler's are my 2nd favorite NFL Team.


Image Source: gigapanorama.org

Top 50 Non-United States countries or places of birth
*Puerto Rico included in Top 50 (but not considered foreign-born)

Pittsburgh, United States 2017

1 India (Bhārat) 11,759
2 China, People's Republic of 9,306
3 Puerto Rico 4,632
4 Italy (Italia) 3,807
5 Philippines (Pilipinas), Republic of the 3,523
6 Germany (Deutschland) 3,433
7 United Kingdom 3,418
8 Russian Federation (Russia) 3,344
9 Vietnam (Việt Nam), Socialist Republic of 2,777
10 Canada 2,731

11 Korea, Republic of (South) 2,097
12 México (Estados Unidos Mexicanos) 2,023
13 Jamaica 1,749
14 Saudi Arabia 1,687
15 Ukraine 1,454
16 Taiwan 1,430
17 Japan 1,428
18 Pakistan 1,237
19 Guatemala 1,221
20 Iran, Islamic Republic of 1,210

21 Uzbekistan (O‘zbekiston) 1,033
22 Brasil 1,010
23 Bosnia and Herzegovina 975
24 Nepal 968
25 Egypt, Arab Republic of 942
26 Kenya 888
27 Nigeria 846
28 Serbia (Srbija) 689
29 Turkey (Türkiye) 644
30 Dominican Republic (República Dominicana) 615

31 Venezuela, Bolivarian Republic of 572
32 Somalia 562
33 Myanmar (Burma) 555
34 Perú 551
35 Australia 549
36 Colombia 538
37 Argentine Republic (Argentina) 524
38 China, Hong Kong (Special Administrative Region) 518
39 France 502
40 El Salvador 498

41 Trinidad and Tobago 494
42 Bangladesh 478
43 Romania (România) 477
44 Afghanistan, Islamic Republic of 448
45 Poland (Polska) 430
46 Greece (Hellenic Republic) 417
47 Panamá 393
48 Kazakhstan (Qazaqstan) 389
49 Ghana 383
50 Syrian Arab Republic (Syria) 381

Total Foreign-born: 93,169
CSA Population: 2,625,053

U.S. Island Areas (Guam, USVI, American Samoa, CNMI) 802


**Top 40 newly added legal permanent residents by country of birth for Pittsburgh unavailable -- the amount of immigrants to the metro were very low.
Total CBSA/MSA or Combined Tallied & Represented of CSA above: 2,706
Total CSA or MSA Legal Permanent Residents: 2,765
Total Legal Permanent Residents by Country of Birth
Source: U.S. Department of Homeland Security.

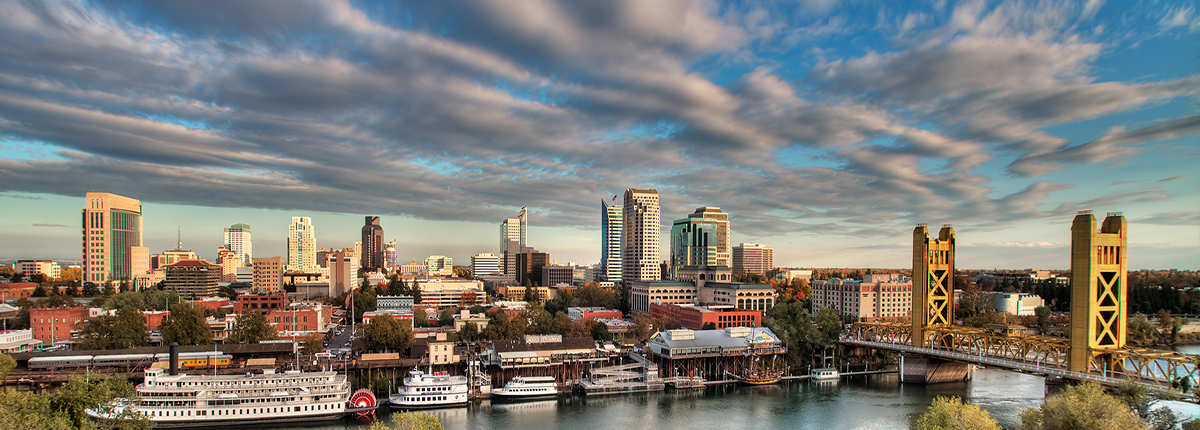
...alright, now we bounce back to the West Coast to the Capital of the U.S.'s largest State by population...


Image Source: medhost.com

Top 50 Non-United States countries or places of birth
*Puerto Rico included in Top 50 (but not considered foreign-born)

Sacramento, United States 2017

1 México (Estados Unidos Mexicanos) 126,976
2 Philippines (Pilipinas), Republic of the 40,146
3 India (Bhārat) 38,212
4 China, People's Republic of 29,070
5 Vietnam (Việt Nam), Socialist Republic of 25,877
6 Ukraine 21,715
7 Fiji Islands 13,686
8 Lao People's Democratic Republic (Laos) 11,038
9 Afghanistan, Islamic Republic of 11,010
10 El Salvador 8,393

11 Korea, Republic of (South) 8,052
12 Thailand 8,045
13 Russian Federation (Russia) 7,718
14 United Kingdom 7,198
15 Iran, Islamic Republic of 7,189
16 Canada 6,949
17 Moldova, Republic of 6,822
18 Germany (Deutschland) 5,803
19 Pakistan 5,301
20 Guatemala 5,254

21 China, Hong Kong (Special Administrative Region) 4,361
22 Taiwan 4,196
23 Iraq 3,937
24 Romania (România) 3,717
25 Japan 3,617
26 Puerto Rico 2,649
27 Armenia (Hayastan) 2,560
28 Nepal 2,553
29 Portugal 2,229
30 Uzbekistan (O‘zbekiston) 2,091

31 Belarus 2,068
32 Nicaragua 1,940
33 Cambodia (Kampuchea) 1,827
34 Kazakhstan (Qazaqstan) 1,811
35 Perú 1,589
36 Colombia 1,540
37 Jordan (Al Urdun) 1,523
38 Israel (Yisra'el) 1,504
39 France 1,428
40 Honduras 1,401

41 Malaysia 1,395
42 Cuba 1,358
43 Panamá 1,336
44 Italy (Italia) 1,308
45 Nigeria 1,114
46 Indonesia 1,095
47 South Africa, Republic of 1,081
48 Brasil 1,021
49 Argentine Republic (Argentina) 986
50 Belgium, Kingdom of 967

Total Foreign-born: 479,273
CSA Population: 2,598,377

U.S. Island Areas (Guam, USVI, American Samoa, CNMI) 2,312

Top 40 newly added legal permanent residents by country of birth

Sacramento--Roseville--Arden-Arcade, CA 2017

1 Afghanistan 3,933
2 Mexico 1,478
3 India 901
4 Philippines 724
5 China, People's Republic 683
6 Vietnam 681
7 Ukraine 546
8 Pakistan 333
9 Iraq 315
10 Iran 271

11 Fiji 240
12 Russia 198
13 Moldova 158
14 El Salvador 109
15 Nepal 98
16 Ethiopia 88
17 Korea, South 73
18 Nigeria 70
19 Armenia 66
20 Canada 60

21 Syria 52
22 Guatemala 50
23 Taiwan 47
24 Brazil 45
25 Jordan 45
26 Romania 43
27 United Kingdom 43
28 Kazakhstan 42
29 Thailand 38
30 Hong Kong 37

31 Peru 37
32 Turkey 37
33 Bangladesh 36
34 Kenya 34
35 Belarus 33
36 Cambodia 33
37 Uzbekistan 27
38 France 25
39 Germany 25
40 Colombia 23

Total CBSA/MSA or Combined Tallied & Represented of CSA above: 12,533
Total CSA or MSA Legal Permanent Residents: 13,295
Total Legal Permanent Residents by Country of Birth
Source: U.S. Department of Homeland Security.

*More immigrants from Afghanistan settled in Sacramento in 2017 than any other metro in the USA. Afghanistan coming out on top is a first for any major U.S. metro, so i'm very interested in seeing if it continues.

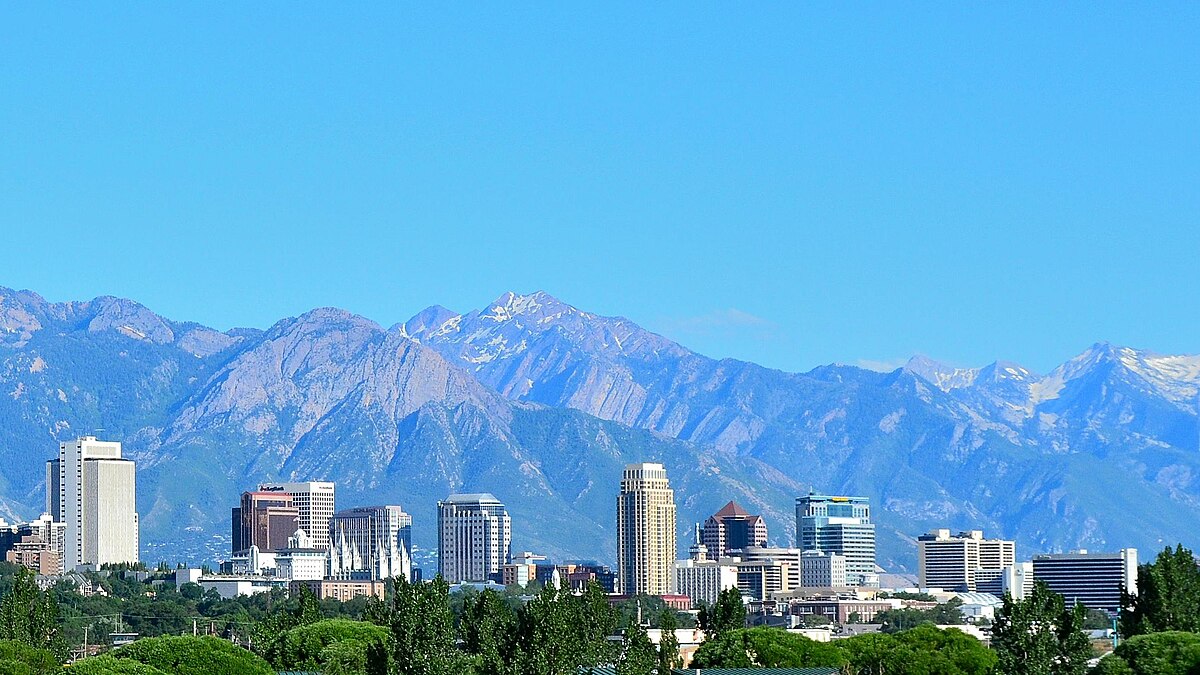
...and now we venture further inland to an area near the Great Salt Lake and the Wasatch Range...


Image Source: wikimedia.org

Top 50 Non-United States countries or places of birth
*Puerto Rico included in Top 50 (but not considered foreign-born)

Salt Lake City, United States 2017

1 México (Estados Unidos Mexicanos) 92,115
2 Canada 8,905
3 India (Bhārat) 8,691
4 Vietnam (Việt Nam), Socialist Republic of 7,407
5 China, People's Republic of 7,024
6 Brasil 6,065
7 Philippines (Pilipinas), Republic of the 5,843
8 El Salvador 5,724
9 Perú 5,029
10 United Kingdom 5,026

11 Guatemala 4,503
12 Germany (Deutschland) 4,102
13 Venezuela, Bolivarian Republic of 4,082
14 Puerto Rico 3,633
15 Korea, Republic of (South) 3,584
16 Colombia 3,224
17 Taiwan 3,001
18 Honduras 2,684
19 Chile 2,636
20 Thailand 2,463

21 Argentine Republic (Argentina) 2,451
22 Ecuador 2,316
23 Bosnia and Herzegovina 2,171
24 Nepal 2,114
25 Somalia 2,106
26 Iran, Islamic Republic of 1,918
27 Iraq 1,474
28 Spain (España) 1,469
29 Lao People's Democratic Republic (Laos) 1,405
30 Russian Federation (Russia) 1,304

31 Japan 1,267
32 Poland (Polska) 1,208
33 Netherlands (Nederland) 1,196
34 Indonesia 1,034
35 Australia 935
36 Uruguay, Eastern Republic of 868
37 South Africa, Republic of 815
38 Cuba 782
39 Croatia (Hrvatska) 767
40 Jamaica 744

41 Ukraine 691
42 China, Hong Kong (Special Administrative Region) 656
43 France 629
44 Italy (Italia) 609
45 Armenia (Hayastan) 608
46 Greece (Hellenic Republic) 577
47 Costa Rica 524
48 Ghana 518
49 Czechoslovakia, former 515
50 Nicaragua 484

Total Foreign-born: 242,023
CSA Population: 2,560,542

U.S. Island Areas (Guam, USVI, American Samoa, CNMI) 2,506

Top 40 newly added legal permanent residents by country of birth

Salt Lake City, UT 2017

1 Mexico 1,064
2 Iraq 167
3 Vietnam 154
4 Peru 134
5 Burma 129
6 China, People's Republic 119
7 India 113
8 Somalia 105
9 Nepal 103
10 Brazil 93

11 El Salvador 88
12 Congo, Democratic Republic 77
13 Venezuela 73
14 Philippines 72
15 Afghanistan 67
16 Iran 55
17 Cuba 54
18 Thailand 54
19 Guatemala 53
20 Ethiopia 45

21 Pakistan 45
22 Colombia 44
23 Rwanda 44
24 Kenya 43
25 Korea, South 41
26 Canada 40
27 Sudan 40
28 Malaysia 38
29 Argentina 33
30 Samoa 32

31 Tonga 31
32 Bhutan 30
33 Chile 30
34 Russia 29
35 Australia 27
36 Cambodia 27
37 Dominican Republic 27
38 Eritrea 25
39 Japan 25
40 Ukraine 25

Total CBSA/MSA or Combined Tallied & Represented of CSA above: 4,065
Total CSA or MSA Legal Permanent Residents: 5,960
Total Legal Permanent Residents by Country of Birth
Source: U.S. Department of Homeland Security.
Reply With Quote
     
     
  #127  
Old Posted Oct 13, 2018, 5:39 AM
Urbanguy's Avatar
Urbanguy Urbanguy is offline
Go Beavs! Go Niners!
 
Join Date: Dec 2001
Location: Portland | Honolulu
Posts: 6,195
Alright, we've got just 6 more U.S. metro's to go before we head back over the Atlantic...

We now arrive back in Ohio to a city that could be considered the "immigrant hub" of Ohio -- as it is now attracting more immigrants than the larger metro area of Cleveland and just may have passed it in foreign-born population size by now. Of course after seeing some of the immigrant figures of other metros -- these numbers may seem insignificant but for a region that has not experienced large scale immigration in years this next city appears to be bucking the trend as it continues to see an increase.


Image Source: ohiolightsout.org

Top 50 Non-United States countries or places of birth
*Puerto Rico included in Top 50 (but not considered foreign-born)

Columbus, United States 2017

1 India (Bhārat) 22,577
2 México (Estados Unidos Mexicanos) 13,767
3 Somalia 10,915
4 China, People's Republic of 9,182
5 Nepal 6,048
6 Ghana 5,600
7 Puerto Rico 5,341
8 Ethiopia 4,617
9 Vietnam (Việt Nam), Socialist Republic of 4,120
10 El Salvador 3,837

11 Philippines (Pilipinas), Republic of the 3,772
12 Canada 3,765
13 United Kingdom 3,689
14 Sierra Leone 3,281
15 Korea, Republic of (South) 2,488
16 Japan 2,342
17 Pakistan 2,323
18 Dominican Republic (República Dominicana) 2,317
19 Germany (Deutschland) 2,004
20 Honduras 1,854

21 Bangladesh 1,698
22 Cambodia (Kampuchea) 1,627
23 Egypt, Arab Republic of 1,491
24 Iraq 1,414
25 Kenya 1,414
26 Nigeria 1,367
27 Indonesia 1,204
28 Ukraine 1,191
29 Cameroon 1,159
30 Guatemala 1,151

31 Jordan (Al Urdun) 1,120
32 Russian Federation (Russia) 1,069
33 Taiwan 990
34 Eritrea (Ertra) 956
35 Colombia 945
36 Iran, Islamic Republic of 942
37 Morocco (Al Maghrib) 935
38 Lao People's Democratic Republic (Laos) 864
39 Albania (Shqiperia) 851
40 Thailand 837

41 Sri Lanka 833
42 Italy (Italia) 811
43 China, Hong Kong (Special Administrative Region) 804
44 Turkey (Türkiye) 798
45 Jamaica 776
46 Brasil 763
47 Venezuela, Bolivarian Republic of 668
48 Netherlands (Nederland) 577
49 Belarus 517
50 Sudan 476

Total Foreign-born: 166,873
CSA Population: 2,481,585

U.S. Island Areas (Guam, USVI, American Samoa, CNMI) 322

Top 40 newly added legal permanent residents by country of birth

Columbus, OH 2017

1 Somalia 697
2 India 432
3 Ghana 421
4 Ethiopia 359
5 Nepal 273
6 Bhutan 257
7 Kenya 253
8 Mexico 212
9 China, People's Republic 206
10 Iraq 187

11 Algeria 129
12 Nigeria 121
13 Sierra Leone 118
14 Jordan 106
15 Dominican Republic 102
16 Cameroon 101
17 Pakistan 82
18 Philippines 80
19 Vietnam 78
20 Burma 77

21 Eritrea 74
22 Guinea 70
23 Liberia 66
24 Senegal 66
25 Canada 62
26 Egypt 60
27 El Salvador 60
28 Morocco 52
29 Syria 52
30 United Kingdom 52

31 Congo, Democratic Republic 50
32 Jamaica 49
33 Afghanistan 45
34 Kuwait 44
35 Brazil 42
36 Mauritania 41
37 Haiti 40
38 Sudan 40
39 Uganda 40
40 Iran 39

Total CBSA/MSA or Combined Tallied & Represented of CSA above: 6,463
Total CSA or MSA Legal Permanent Residents: 6,560
Total Legal Permanent Residents by Country of Birth
Source: U.S. Department of Homeland Security.

...now we bounce back to the West for a little fun under the bright neon lights of a city that never sleeps...it's also nicked named the 9th Island by people from Hawaii because of the thousands of expats that live there and the thousands of Hawaii residents that vacation there annually (yes, even people from Hawaii go on vacation and this is one of the places that they like to go).


Image Source: BookMundi

Top 50 Non-United States countries or places of birth
*Puerto Rico included in Top 50 (but not considered foreign-born)

Las Vegas, United States 2017

1 México (Estados Unidos Mexicanos) 198,512
2 Philippines (Pilipinas), Republic of the 89,875
3 El Salvador 26,938
4 Cuba 21,833
5 China, People's Republic of 12,906
6 Guatemala 12,282
7 Korea, Republic of (South) 10,786
8 India (Bhārat) 9,524
9 Canada 9,187
10 Vietnam (Việt Nam), Socialist Republic of 8,907

11 Ethiopia 8,039
12 United Kingdom 6,094
13 Thailand 5,470
14 Germany (Deutschland) 5,202
15 Puerto Rico 4,776
16 Honduras 4,631
17 Japan 4,613
18 Iran, Islamic Republic of 4,013
19 Taiwan 3,914
20 Brasil 3,564

21 Nicaragua 3,352
22 Bulgaria (Balgariya) 3,069
23 Israel (Yisra'el) 3,042
24 Colombia 2,815
25 Perú 2,713
26 Dominican Republic (República Dominicana) 2,515
27 China, Hong Kong (Special Administrative Region) 2,355
28 Romania (România) 2,342
29 Lao People's Democratic Republic (Laos) 2,015
30 Russian Federation (Russia) 1,871

31 South Africa, Republic of 1,766
32 Myanmar (Burma) 1,755
33 France 1,590
34 Pakistan 1,568
35 Belize 1,544
36 Armenia (Hayastan) 1,513
37 Poland (Polska) 1,477
38 Italy (Italia) 1,404
39 Hungary (Magyarország) 1,340
40 Jamaica 1,335

41 Venezuela, Bolivarian Republic of 1,331
42 Panamá 1,291
43 Nigeria 1,179
44 Egypt, Arab Republic of 1,159
45 Sudan 1,116
46 Argentine Republic (Argentina) 1,109
47 Eritrea (Ertra) 1,089
48 Indonesia 1,065
49 Sri Lanka 1,040
50 Afghanistan, Islamic Republic of 1,038

Total Foreign-born: 525,323
CSA Population: 2,455,481

U.S. Island Areas (Guam, USVI, American Samoa, CNMI) 5,382

Top 40 newly added legal permanent residents by country of birth

Las Vegas-Henderson-Paradise, NV 2017

1 Mexico 2,341
2 Cuba 1,881
3 Philippines 1,488
4 China, People's Republic 591
5 Ethiopia 551
6 El Salvador 376
7 Vietnam 248
8 Korea, South 154
9 Guatemala 136
10 Iran 134

11 India 128
12 Colombia 120
13 Thailand 113
14 Canada 109
15 Afghanistan 106
16 Brazil 98
17 Israel 98
18 Peru 97
19 Eritrea 91
20 Russia 82

21 Honduras 79
22 Bulgaria 77
23 United Kingdom 75
24 Dominican Republic 72
25 Congo, Democratic Republic 70
26 Japan 53
27 Armenia 52
28 Argentina 51
29 Pakistan 50
30 Nigeria 48

31 Venezuela 48
32 Ukraine 46
33 Moldova 44
34 Romania 43
35 France 38
36 Serbia 38
37 Italy 36
38 Australia 35
39 Ecuador 34
40 Jamaica 34

Total CBSA/MSA or Combined Tallied & Represented of CSA above: 11,052
Total CSA or MSA Legal Permanent Residents: 11,248
Total Legal Permanent Residents by Country of Birth
Source: U.S. Department of Homeland Security.

Yes, I know, we're criss-crossing the U.S. so here we go back East to North Carolina and to the "Research Triangle"


Image Source: mba.ncsu.edu

Top 50 Non-United States countries or places of birth
*Puerto Rico included in Top 50 (but not considered foreign-born)

Raleigh-Durham, United States 2017

1 México (Estados Unidos Mexicanos) 63,431
2 India (Bhārat) 33,636
3 China, People's Republic of 14,225
4 Honduras 10,962
5 El Salvador 10,664
6 Puerto Rico 9,741
7 Canada 9,501
8 Vietnam (Việt Nam), Socialist Republic of 6,727
9 Guatemala 6,619
10 United Kingdom 6,579

11 Philippines (Pilipinas), Republic of the 6,209
12 Korea, Republic of (South) 4,556
13 Germany (Deutschland) 4,516
14 Russian Federation (Russia) 3,432
15 Nigeria 3,162
16 Colombia 2,673
17 Yemen (Al Yaman) 2,492
18 Sierra Leone 2,405
19 Jamaica 2,196
20 Taiwan 1,987

21 Kenya 1,870
22 Dominican Republic (República Dominicana) 1,867
23 Venezuela, Bolivarian Republic of 1,836
24 Japan 1,775
25 Egypt, Arab Republic of 1,657
26 Poland (Polska) 1,531
27 Brasil 1,501
28 Liberia 1,473
29 Ethiopia 1,393
30 Morocco (Al Maghrib) 1,329

31 Myanmar (Burma) 1,287
32 Cuba 1,271
33 Ukraine 1,263
34 France 1,261
35 Syrian Arab Republic (Syria) 1,193
36 Iran, Islamic Republic of 1,106
37 South Africa, Republic of 1,105
38 Perú 1,061
39 Bangladesh 1,004
40 Panamá 978

41 Turkey (Türkiye) 939
42 Australia 892
43 Romania (România) 878
44 Ecuador 855
45 Nepal 855
46 Sweden 811
47 Thailand 752
48 Haïti 719
49 Argentine Republic (Argentina) 709
50 Chile 703

Total Foreign-born: 260,271
CSA Population: 2,199,459

U.S. Island Areas (Guam, USVI, American Samoa, CNMI) 2,974

Top 40 newly added legal permanent residents by country of birth

Raleigh, NC 2017

1 India 666
2 Mexico 504
3 China, People's Republic 303
4 Vietnam 199
5 Dominican Republic 164
6 Congo, Democratic Republic 135
7 Nepal 105
8 Korea, South 99
9 Morocco 99
10 Iraq 95

11 Bangladesh 93
12 Honduras 93
13 El Salvador 92
14 Kenya 92
15 Nigeria 92
16 Philippines 87
17 Pakistan 85
18 United Kingdom 85
19 Cuba 80
20 Afghanistan 79

21 Brazil 71
22 Canada 71
23 Colombia 66
24 Iran 64
25 Ethiopia 63
26 Russia 61
27 Venezuela 52
28 Jordan 45
29 Egypt 44
30 Peru 37

31 South Africa 35
32 Turkey 35
33 Burma 33
34 Guatemala 32
35 France 31
36 Sudan 30
37 Tanzania 30
38 Ukraine 30
39 Yemen 27
40 Gambia 25

Total CBSA/MSA or Combined Tallied & Represented of CSA above: 4,924
Total CSA or MSA Legal Permanent Residents: 6,937
Total Legal Permanent Residents by Country of Birth
Source: U.S. Department of Homeland Security.

...just three more to go!
Reply With Quote
     
     
  #128  
Old Posted Oct 13, 2018, 5:57 AM
Urbanguy's Avatar
Urbanguy Urbanguy is offline
Go Beavs! Go Niners!
 
Join Date: Dec 2001
Location: Portland | Honolulu
Posts: 6,195
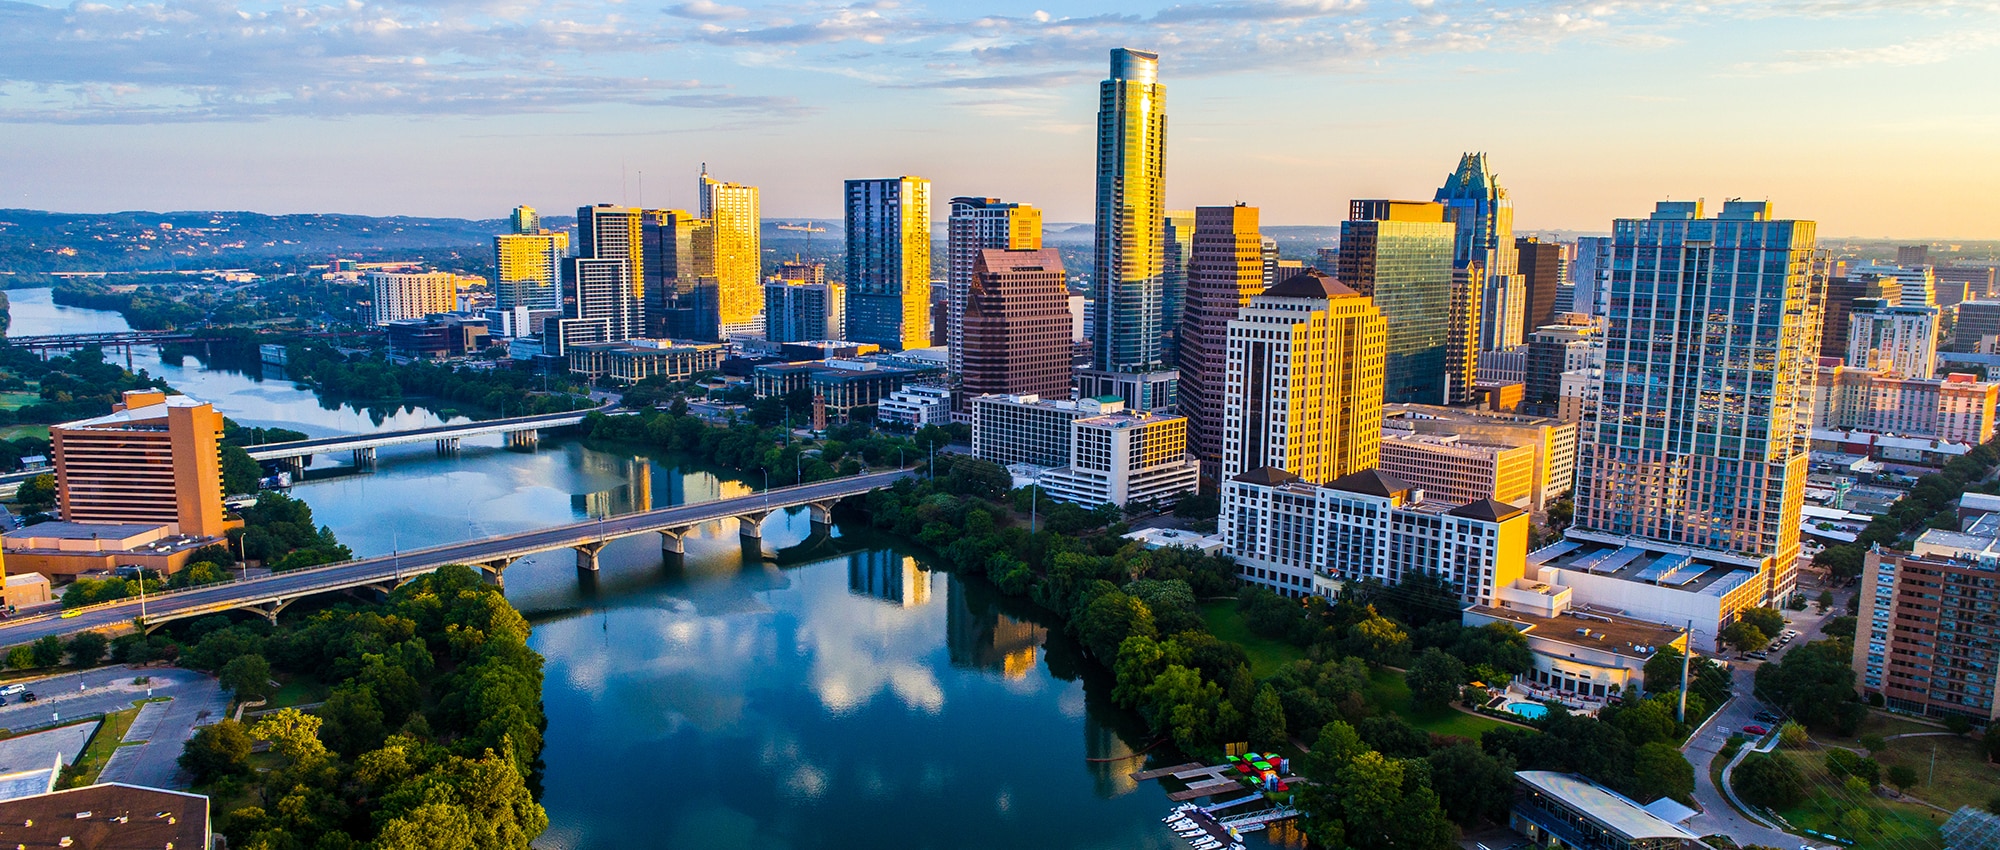
Back to Texas we go to a city that has changed dramatically in recent years, has a great music scene and seems to be on the radar for a lot of people -- it's also where Portland got the whole "Keep Portland Weird" slogan from as it started in...


Image Source: aquilacommercial.com

Top 50 Non-United States countries or places of birth
*Puerto Rico included in Top 50 (but not considered foreign-born)

Austin, United States 2017

1 México (Estados Unidos Mexicanos) 134,655
2 India (Bhārat) 31,355
3 Vietnam (Việt Nam), Socialist Republic of 10,706
4 Honduras 10,071
5 China, People's Republic of 9,870
6 Korea, Republic of (South) 7,235
7 Puerto Rico 6,994
8 Cuba 6,527
9 El Salvador 6,339
10 Philippines (Pilipinas), Republic of the 6,027

11 Pakistan 5,379
12 United Kingdom 4,778
13 Venezuela, Bolivarian Republic of 3,910
14 Canada 3,850
15 Iraq 3,649
16 Guatemala 3,631
17 Germany (Deutschland) 3,413
18 Iran, Islamic Republic of 3,362
19 Colombia 3,173
20 Perú 2,721

21 Taiwan 2,391
22 Russian Federation (Russia) 2,329
23 Ethiopia 2,260
24 Japan 2,142
25 Nigeria 2,038
26 China, Hong Kong (Special Administrative Region) 1,925
27 Ghana 1,756
28 Nicaragua 1,674
29 Brasil 1,647
30 Nepal 1,514

31 France 1,241
32 Spain (España) 1,210
33 Panamá 1,196
34 Bangladesh 1,122
35 Australia 1,120
36 Cameroon 1,053
37 Ukraine 1,040
38 Saudi Arabia 943
39 Kuwait (Al Kuwayt) 929
40 Egypt, Arab Republic of 914

41 Turkey (Türkiye) 895
42 Poland (Polska) 855
43 Indonesia 826
44 Sudan 788
45 Ecuador 781
46 Jamaica 772
47 Ireland, Republic of (Éire) 751
48 Lebanese Republic (Lebanon) 739
49 Myanmar (Burma) 701
50 Somalia 673

Total Foreign-born: 319,830
MSA Population: 2,115,827

U.S. Island Areas (Guam, USVI, American Samoa, CNMI) 1,107

Top 40 newly added legal permanent residents by country of birth

Austin-Round Rock, TX 2017

1 Mexico 1,954
2 Cuba 749
3 India 516
4 Iraq 370
5 Afghanistan 315
6 Vietnam 273
7 China, People's Republic 266
8 Korea, South 173
9 Nepal 172
10 Honduras 167

11 Philippines 147
12 United Kingdom 136
13 Pakistan 122
14 Brazil 118
15 El Salvador 115
16 Canada 108
17 Iran 93
18 Ethiopia 87
19 Nigeria 87
20 Russia 75

21 Burma 72
22 Congo, Democratic Republic 69
23 France 62
24 Venezuela 62
25 Colombia 59
26 Algeria 57
27 Australia 52
28 Guatemala 52
29 Bangladesh 48
30 Taiwan 47

31 Thailand 46
32 Ukraine 43
33 Sudan 42
34 Syria 41
35 Turkey 41
36 Germany 40
37 Egypt 34
38 Israel 33
39 Kenya 31
40 Cameroon 30

Total CBSA/MSA or Combined Tallied & Represented of CSA above: 7,908
Total CSA or MSA Legal Permanent Residents: 7,908
Total Legal Permanent Residents by Country of Birth
Source: U.S. Department of Homeland Security.

Next up we travel back to the Great Lakes...and although this next city is closer to Chicago than Minneapolis -- it shares a couple of immigrant trends with the Twin Cities more than Chicago and that is Hmong from places like Laos and Thailand and now Burmese and Karen peoples from Myanmar (Burma)...


Image Source: bfest.beretta.net

Top 50 Non-United States countries or places of birth
*Puerto Rico included in Top 50 (but not considered foreign-born)

Milwaukee, United States 2017

1 México (Estados Unidos Mexicanos) 43,028
2 India (Bhārat) 14,149
3 Puerto Rico 13,608
4 China, People's Republic of 5,070
5 Lao People's Democratic Republic (Laos) 3,859
6 Germany (Deutschland) 3,744
7 Thailand 3,436
8 Myanmar (Burma) 3,252
9 Korea, Republic of (South) 2,927
10 Russian Federation (Russia) 2,898

11 Canada 2,863
12 Poland (Polska) 2,689
13 Philippines (Pilipinas), Republic of the 2,545
14 United Kingdom 2,347
15 Vietnam (Việt Nam), Socialist Republic of 2,234
16 Nigeria 1,744
17 Malaysia 1,605
18 Colombia 1,535
19 Saudi Arabia 1,468
20 Pakistan 1,259

21 Somalia 1,179
22 Iraq 1,173
23 Romania (România) 1,161
24 Italy (Italia) 1,125
25 Albania (Shqiperia) 1,107
26 Iran, Islamic Republic of 1,017
27 Ukraine 987
28 Jamaica 879
29 Netherlands (Nederland) 849
30 Croatia (Hrvatska) 821

31 Greece (Hellenic Republic) 818
32 Nicaragua 803
33 Serbia (Srbija) 748
34 Brasil 745
35 Dominican Republic (República Dominicana) 655
36 Cuba 645
37 Japan 632
38 Bosnia and Herzegovina 591
39 Guatemala 575
40 Eritrea (Ertra) 561

41 Israel (Yisra'el) 520
42 Honduras 453
43 Czechoslovakia, former 448
44 Ethiopia 415
45 Ghana 401
46 Latvia (Latvija) 393
47 Bangladesh 380
48 Lithuania (Lietuva) 375
49 Turkey (Türkiye) 369
50 Jordan (Al Urdun) 367

Total Foreign-born: 134,266
CSA Population: 2,048,007

U.S. Island Areas (Guam, USVI, American Samoa, CNMI) 72

Top 40 newly added legal permanent residents by country of birth

Milwaukee-Waukesha-West Allis, WI 2017

1 Mexico 574
2 Burma 484
3 India 279
4 Malaysia 203
5 Thailand 118
6 China, People's Republic 112
7 Iraq 87
8 Albania 77
9 Pakistan 76
10 Vietnam 53

11 Philippines 49
12 Jordan 45
13 Somalia 45
14 Canada 36
15 Congo, Democratic Republic 35
16 Dominican Republic 35
17 United Kingdom 35
18 Ethiopia 33
19 Egypt 30
20 Jamaica 27

21 Ukraine 26
22 Nigeria 25
23 Russia 23
24 Colombia 21
25 Iran 21
26 Nepal 21
27 Sudan 21
28 Korea, South 20
29 Peru 20
30 Afghanistan 17

31 El Salvador 17
32 Eritrea 17
33 Laos 16
34 Bangladesh 15
35 Kenya 15
36 Macedonia 15
37 Brazil 14
38 South Africa 14
39 Saudi Arabia 13
40 Serbia 13

Total CBSA/MSA or Combined Tallied & Represented of CSA above: 3,176
Total CSA or MSA Legal Permanent Residents: 3,541
Total Legal Permanent Residents by Country of Birth
Source: U.S. Department of Homeland Security.

...and now we bring our journey to close in the United States, for now by ending our last stop back on the East Coast before we head even further east...


Image Source: civicrm.org

Top 50 Non-United States countries or places of birth
*Puerto Rico included in Top 50 (but not considered foreign-born)

Hartford, United States 2017

1 Puerto Rico 44,626
2 India (Bhārat) 17,609
3 Jamaica 17,530
4 Poland (Polska) 13,722
5 China, People's Republic of 12,432
6 Dominican Republic (República Dominicana) 8,806
7 Italy (Italia) 7,080
8 Canada 5,924
9 Perú 5,900
10 México (Estados Unidos Mexicanos) 5,697

11 Vietnam (Việt Nam), Socialist Republic of 4,883
12 Korea, Republic of (South) 4,821
13 United Kingdom 4,437
14 Colombia 4,055
15 Ghana 3,433
16 Germany (Deutschland) 3,242
17 Guyana 3,139
18 Portugal 3,048
19 El Salvador 3,011
20 Brasil 2,250

21 Haïti 2,190
22 Pakistan 2,037
23 Bosnia and Herzegovina 1,959
24 Taiwan 1,936
25 Guatemala 1,924
26 Nigeria 1,736
27 Trinidad and Tobago 1,721
28 Cuba 1,614
29 Philippines (Pilipinas), Republic of the 1,544
30 Ecuador 1,529

31 Albania (Shqiperia) 1,508
32 Ukraine 1,453
33 Russian Federation (Russia) 1,354
34 Japan 1,309
35 Bangladesh 1,268
36 Honduras 1,170
37 Spain (España) 1,144
38 Lebanese Republic (Lebanon) 1,125
39 Greece (Hellenic Republic) 1,105
40 Romania (România) 1,088

41 Dominica (Waitikubuli) 1,013
42 Egypt, Arab Republic of 943
43 Nepal 907
44 Lao People's Democratic Republic (Laos) 903
45 Venezuela, Bolivarian Republic of 898
46 Lithuania (Lietuva) 791
47 France 716
48 Ireland, Republic of (Éire) 645
49 China, Hong Kong (Special Administrative Region) 632
50 Cambodia (Kampuchea) 537

Total Foreign-born: 186,186
CSA Population: 1,479,292

U.S. Island Areas (Guam, USVI, American Samoa, CNMI) 377

Top 40 newly added legal permanent residents by country of birth

Hartford-West Hartford-East Hartford, CT 2017

1 Jamaica 609
2 India 550
3 Dominican Republic 194
4 Ghana 172
5 China, People's Republic 140
6 Poland 133
7 Peru 112
8 Albania 103
9 Pakistan 98
10 Nepal 83

11 Mexico 70
12 Colombia 69
13 Philippines 64
14 Vietnam 64
15 Bangladesh 60
16 Ukraine 59
17 Brazil 55
18 Guyana 53
19 Ecuador 51
20 United Kingdom 45

21 Korea, South 43
22 Nigeria 42
23 Afghanistan 41
24 Sudan 33
25 Canada 30
26 Haiti 30
27 Thailand 30
28 Algeria 28
29 Egypt 26
30 Iran 26

31 Yemen 26
32 Saint Lucia 25
33 Honduras 24
34 Syria 24
35 Jordan 23
36 El Salvador 21
37 Guatemala 21
38 Congo, Democratic Republic 20
39 Cuba 20
40 Italy 20

Total CBSA/MSA or Combined Tallied & Represented of CSA above: 3,834
Total CSA or MSA Legal Permanent Residents: 4,394
Total Legal Permanent Residents by Country of Birth
Source: U.S. Department of Homeland Security.

...Hope you've all enjoyed this segment... next time around we will be exploring Spain, Sweden, Tanzania, Belgium & more so stay tuned!

Last edited by Urbanguy; Oct 13, 2018 at 7:18 AM.
Reply With Quote
     
     
  #129  
Old Posted Oct 13, 2018, 6:07 AM
Urbanguy's Avatar
Urbanguy Urbanguy is offline
Go Beavs! Go Niners!
 
Join Date: Dec 2001
Location: Portland | Honolulu
Posts: 6,195
Quote:
Originally Posted by Capsicum View Post
Seeing Canada show up on the foreign born list in various US cities is interesting -- especially with the prominence of the "snowbirds" in Phoenix.

What's the largest Canadian-born population in any city outside Canada, I'm wondering? LA?

(Conversely with the US-born making the list of top immigrants in some Canadian cities, I'd be curious if the most US-born outside of the US was in Canada or elsewhere, such as in Mexico with the American-born Mexican diaspora?)
It would definitely be LA. Only New York City comes close from all that i've seen statistically. As for the most US-born settled outside of the US it would be in Mexico -- it's nearing a million officially but could be higher unofficially. The majority appear to be of Mexican descent but a larger share especially those that have settled in Baja California are often White Americans that have retired there. After Mexico it's Canada followed by the UK.
Reply With Quote
     
     
  #130  
Old Posted Oct 13, 2018, 7:10 AM
Urbanguy's Avatar
Urbanguy Urbanguy is offline
Go Beavs! Go Niners!
 
Join Date: Dec 2001
Location: Portland | Honolulu
Posts: 6,195
Of course we cannot leave the U.S. without a little representation of the first "Americans" or Aboriginal people's of the country.

Native Americans aka American Indians

Image Source: fortlewis.edu

Native Hawaiian or Kānaka Maoli

Image Source: bdavidcathell.com

Alaska Natives

Image Source: sealaskaheritage.org

In the 2010 Census the Top 30 largest populations of Aboriginal People's in the U.S. were:

*The following are of those of one tribe or single origin only (meaning not of mixed tribes or with other ancestries and races)*

1 Navajo 286,731
2 Cherokee 284,247
3 Native Hawaiian (Kānaka Maoli) 156,146
4 Chippewa 112,757
5 Sioux 112,176
6 Choctaw 103,910
7 Apache 63,193
8 Lumbee 62,306
9 Pueblo 49,695
10 Creek 48,352

11 Iroquois 40,570
12 Yup'ik 28,927
13 Chickasaw 27,973
14 Blackfeet 27,279
15 Inupiat 24,859
16 Pima 22,040
17 Yaqui 21,679
18 Potawatomi 20,412
19 Tohono O'Odham 19,522
20 Alaskan Athabascan 15,623

21 Tlingit-Haida 15,256
22 Puget Sound Salish 14,320
23 Seminole 14,080
24 Spanish American Indian 13,460
25 Hopi 12,580
26 Comanche Nation 12,284
27 Aleut 11,920
28 Cheyenne 11,375
29 Crow 10,332
30 Kiowa 9,437

American Indian and Alaska Native Total population (Excluding Native Hawaiian): 2,879,638, mixed with at least one other tribe but not with non-Native Americans: 2,932,248
American Indian, Alaska Native and Native Hawaiian Total population (unmixed): 3,035,784

Others Native Americans (un-mixed) with origins in other countries were:

Mexican American Indian (e.g., Nahuatl, Zapotec, Mixtec, etc): 121,221

South American Indian (e.g., Quechua, Guaraní, Mapuche/Araucanian, Aymara, etc): 20,901

Central American Indian (e.g., Garifuna, Lenca, Miskito, Kuna, Carib, etc): 15,882

Canadian and French American Indian (e.g., Ojibway, Abenaki, Métis, Algonquin, etc): 6,433

Top 30 (estimated) Native/Aboriginal languages spoken in the U.S. ages 5 and over in 2013

1 Navajo 166,826
2 Hawaiian (Ōlelo Hawaiʻi) 26,205
3 Yupik 19,750
4 Dakota 17,855
5 Apache 13,445
6 Keres 13,190
7 Cherokee 11,465
8 Ojibwa 9,735
9 Choctaw 9,635
10 Zuni 9,615

11 Pima 6,990
12 Inupik 6,740
13 Hopi 6,075
14 Tewa 4,620
15 Muskogee 4,465
16 Crow 4,160
17 Tiwa 2,180
18 Shoshoni 2,000
19 Mohawk 1,945
20 Towa 1,925

21 Cheyenne 1,920
22 Ute 1,895
23 Winnebago 1,720
24 Blackfoot 1,450
25 Salish 1,350
26 Paiute 1,305
27 Sahaptian 1,295
28 Kuchin 1,285
29 Eskimo 1,270
30 Athapascan 1,265

Sources: US Census, American Community Survey

Reply With Quote
     
     
  #131  
Old Posted Oct 13, 2018, 2:43 PM
Crawford Crawford is online now
Registered User
 
Join Date: Nov 2003
Location: Brooklyn, NYC/Polanco, DF
Posts: 34,794
Quote:
Originally Posted by Urbanguy View Post
Also, i'll give you a couple of examples of Europe, namely Eastern Europe being represented in the Top source countries of immigrants to NYC which continued up until at least the early 2000's. The shift and trends you're seeing now with European countries ranking lower are fairly recent.
Also, the European source countries are ranked lower for NYC than for a few other metros because NYC gets a crapload of immigrants from everywhere, and other metros don't. For example, Cleveland will rank "higher" because their European postwar legacy immigrants are still in the top 20.

Also, the breakup of Soviet Union plays a role, because NYC is the #1 destination for basically every former Soviet State (by a longshot), but it's broken down into 15 countries. Same deal for former Yugoslavia.

NYC is really the only place in the U.S. where you can still see first generation Italian and Irish areas, the Polish areas are more defined and recent than in Chicago, the former Soviet areas are vast, and there are enough professional European expats to form enclaves (like French in Cobble Hill).
Reply With Quote
     
     
  #132  
Old Posted Oct 13, 2018, 3:49 PM
Jonesy55 Jonesy55 is offline
Registered User
 
Join Date: Jul 2005
Posts: 1,336
So at 3.5% foreign born is Pittsburgh the least international major metro area in the US/Canada?
Reply With Quote
     
     
  #133  
Old Posted Oct 13, 2018, 3:51 PM
Jonesy55 Jonesy55 is offline
Registered User
 
Join Date: Jul 2005
Posts: 1,336
Quote:
Originally Posted by Crawford View Post
NYC is really the only place in the U.S. where you can still see first generation Italian and Irish areas,
Do you still see many first generation Irish in Boston?
Reply With Quote
     
     
  #134  
Old Posted Oct 13, 2018, 4:15 PM
Crawford Crawford is online now
Registered User
 
Join Date: Nov 2003
Location: Brooklyn, NYC/Polanco, DF
Posts: 34,794
Quote:
Originally Posted by Jonesy55 View Post
Do you still see many first generation Irish in Boston?
Boston overall is much more Irish than NYC, but didn't have the wave of more recent immigration. Boston Irish are much more prominent but more suburbanized/assimilated.

Certain sections of Bronx, Queens and Yonkers had significant Irish immigration up till about 20 years ago, and it isn't hard to find immigration societies and Irish-accented residents today.

Katonah Ave. in the North Bronx and McLean Ave. in adjacent Yonkers are still first generation Irish. That North Bronx-Yonkers area is probably the only "real" Irish neighborhood left in the Americas (proper Irish groceries and the like).

This is the Irish North Bronx:
https://www.google.com/maps/@40.8999267,...itch%3D0%26thumbfov%3D100!7i16384!8i8192

The Irish boom pretty much ended the wave, however.
Reply With Quote
     
     
  #135  
Old Posted Oct 13, 2018, 4:26 PM
Crawford Crawford is online now
Registered User
 
Join Date: Nov 2003
Location: Brooklyn, NYC/Polanco, DF
Posts: 34,794
Here's McLean Ave. in Yonkers. It's basically the same Irish area as North Bronx, but crosses the city boundary:
https://www.google.com/maps/@40.9034471,...pLHxy_0EHLMucp9d1awCA!2e0!7i16384!8i8192

Woodside, Queens also had many Irish immigrants (and still has the Emerald Isle Immigration Center, and a number of pubs and groceries) but no longer feels very Irish. More recent immigrants + gentrification have transformed the area (kinda like South Boston, which is famously Irish but doesn't feel very Irish in 2018).
Reply With Quote
     
     
  #136  
Old Posted Oct 15, 2018, 3:16 AM
Urbanguy's Avatar
Urbanguy Urbanguy is offline
Go Beavs! Go Niners!
 
Join Date: Dec 2001
Location: Portland | Honolulu
Posts: 6,195
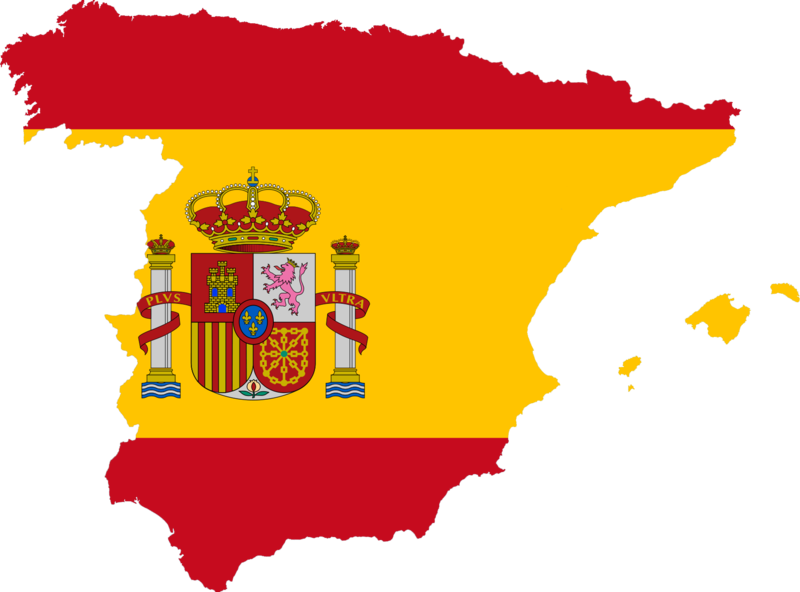
Across the Atlantic Ocean we go to Southern Europe and the country of Spain!

...but first a little history about Spain as brought to you by: spain.info

"The history of Spain is a compendium of influences from the different cultures that have lived in the country.

The first settlers on the Peninsula were the Celts and the Iberians. The first testimonials written about the country date back to this period. It is said that Hispania (the name the Romans used to describe the Peninsula) is a word of Semitic origin from Hispalis (Seville). From the year 1100 B.C. and until the middle of the 3rd century B.C., commercial and cultural contact with high Mediterranean civilisations was held with the Phoenicians and Greeks. At the end of this era, both civilisations were taken over by the Carthaginians and Romans, respectively. The Roman presence in Hispania lasted for seven centuries, during which time the basic borders of the Peninsula in relation to other European towns were set up. In addition to territorial administration, many more institutions were inherited from Rome such as the concept of family, Latin as a language, religion and law. At the start of the 5th century new settlers from the North arrive and settle on the Peninsula: the Visigoths in the interior and the Swabians on the West. This Germanic people saw themselves as the continuators of the weakened Imperial power. Integration between Hispanic-Germanics was a rapid process, with the exception of the Northeast of the peninsula, inhabited by Basques, Cantabrians and Asturians, who resisted the infiltration of the Romans, Visigoths and later the Muslims.

The decomposition of the Visigoth state apparatus would lead to the successive infiltration of Arab and Berber troops from the other side of the Straits of Gibraltar at the beginning of the 8th century. In the middle of the 8th, century the Muslims had completed occupation and Cordoba became the centre of the flourishing Andalusian state. The Arab presence in Spain would last for almost seven centuries and leave an indelible mark on the Spanish cultural heritage. Following a long period of peaceful coexistence, the small Christian strongholds in the North of the Peninsula took on a leading role in the Reconquest, which ended with the capture of Granada in 1492 under the reign of the Catholic King and Queen, traditionally considered the founders of peninsular unity and the imperial management of the Spanish revival. Also during the reign of the Catholic King and Queen and under their auspice, Columbus discovered the New Continent (America), new boundary of what would be the largest Western empire. The 16th century represents the zenith of Spanish hegemony in the world, a process that would last until the middle of the 17th century. With the Catholic King and Queen, and in particular with Phillip II, what was the prototype of the absolutist modern State in the 16th century was fully established. Following the death of Charles II, the last of the Austrians, who died without having had children, Phillip V inaugurated the dynasty of the Borbons of Spain. The Spanish Enlightenment is characterised as being an era of exterior harmony, reformations and interior development. The crisis of the Old Order opened the doorway to the Napoleonic invasion. The War of Independence was a war against the French invasion, but also a revolutionary war due to the decisive involvement of the people and the clear formation of a national conscience that would later shape the 1812 Constitution. The Courts of Cadiz thereby enacted one of the first Constitutions of the world which ratified that sovereignty would reside in the nation.

The conflict between liberalists and absolutists, or in other words, between two different ways of perceiving the establishment of the state, would be one of the longest Spanish conflicts throughout the 19th century. The brief reign of Amadeo de Saboya, the first republican experience and the subsequent restoration of the monarchy, under the rule of Alfonso XII, take Spain to the beginning of the 20th century with a series of serious unresolved problems that intensify following the definitive loss of the last strongholds of the colonial empire: Cuba and the Philippines. Despite the interruption of the First World War in which Spain remained neutral and following the dictatorship of Primo de Rivera, the monarchical crisis returns, resulting in the exile of King Alfonso XIII. The ballot box is introduced into Spain and with it the first democratic experience of the 20th century: the second Republic, a brief attempt to introduce the reformations the country needed, frustrated by General Franco's military rising and the outbreak of the Civil War in 1936.

The military victory of General Franco gave way to a long dictatorial period that would last until 1975; it was an era characterised by an iron control of interior politics and isolation from the international environment, which did not however prevent an incipient economic development in the sixties. Following the death of General Franco, the Spanish people peacefully made the transition from dictatorship to democracy in a process known as 'the Spanish model'. Don Juan Carlos I, as King of the Spanish people, became the chief of a social and democratic state of law, which moulded the Constitution of 1978. In 2014 his son, King Felipe VI, succeeded him to the throne.
"


Image Source: wikimedia.org

Top 50 Non-Spain countries or places of birth

Spain (España) 2018

1 Morocco (Al Maghrib) 713,320
2 Romania (România) 596,595
3 Ecuador 408,798
4 Colombia 386,331
5 United Kingdom 288,935
6 Argentine Republic (Argentina) 261,121
7 Venezuela, Bolivarian Republic of 244,671
8 France 208,014
9 Perú 200,571
10 Germany (Deutschland) 193,229

11 Dominican Republic (República Dominicana) 170,447
12 China, People's Republic of 165,793
13 Bolivia, Plurinational State of 150,208
14 Cuba 144,957
15 Italy (Italia) 135,352
16 Bulgaria (Balgariya) 116,702
17 Brasil 115,562
18 Portugal 104,457
19 Ukraine 96,809
20 Russian Federation (Russia) 87,885

21 Uruguay, Eastern Republic of 75,509
22 Honduras 73,323
23 Paraguay (Paraguáype) 68,474
24 Switzerland (Swiss Confederation) 62,692
25 Poland (Polska) 60,529
26 Chile 57,126
27 Algeria (Al Jaza'ir) 56,390
28 Pakistan 55,833
29 México (Estados Unidos Mexicanos) 54,948
30 Sénégal 52,501

31 United States of America 50,619
32 Netherlands (Nederland) 47,976
33 Belgium, Kingdom of 47,768
34 Philippines (Pilipinas), Republic of the 47,147
35 India (Bhārat) 39,848
36 Nicaragua 30,302
37 Nigeria 28,008
38 Equatorial Guinea (Guinea Ecuatorial) 21,300
39 Moldova, Republic of 19,612
40 Sweden 19,593

41 Gambia, The 17,819
42 Mali 17,105
43 Lithuania (Lietuva) 15,565
44 Ireland, Republic of (Éire) 14,979
45 Norway (Norge) 14,438
46 Finland (Suomi) 12,547
47 Ghana 12,252
48 Bangladesh 12,058
49 Denmark (Danmark) 11,161
50 Guinea (Guinée) 9,956

Population by foreign country of birth: 6,200,933
Total Population: 46,659,302
Source: INE (Spain)
*Spain has the largest population of people born in Equatorial Guinea, Bolivia, Argentina, Paraguay & Uruguay outside of their regions of origin (e.g., Africa, South America). It also has one of the largest populations of people born in Morocco & Romania outside of their countries.

The immigrant population of Spain has shrunk since the 2011 Census as a result of their 2008–2014 financial crisis but is starting to increase again now that the economy has improved. The make up of the foreign born closely resembles that of Italy's (with maybe a dash of France) than most other European countries.


Image Source: wikimedia.org

Top 50 Non-Spain countries or places of birth

Spain (España) 2011

1 Morocco (Al Maghrib) 772,126
2 Romania (România) 750,901
3 Ecuador 474,075
4 Colombia 374,642
5 United Kingdom 317,950
6 Argentine Republic (Argentina) 272,198
7 Germany (Deutschland) 209,982
8 France 209,144
9 Perú 198,547
10 Bolivia, Plurinational State of 190,997

11 China, People's Republic of 164,368
12 Venezuela, Bolivarian Republic of 155,153
13 Dominican Republic (República Dominicana) 146,613
14 Bulgaria (Balgariya) 144,571
15 Portugal 128,639
16 Brasil 120,436
17 Cuba 116,852
18 Italy (Italia) 93,961
19 Ukraine 81,304
20 Uruguay, Eastern Republic of 80,571

21 Paraguay (Paraguáype) 79,850
22 Poland (Polska) 71,524
23 Pakistan 68,279
24 Russian Federation (Russia) 66,478
25 Switzerland (Swiss Confederation) 63,191
26 Chile 62,626
27 Algeria (Al Jaza'ir) 59,201
28 Sénégal 55,748
29 México (Estados Unidos Mexicanos) 47,609
30 Netherlands (Nederland) 47,004

31 Belgium, Kingdom of 42,107
32 Philippines (Pilipinas), Republic of the 41,020
33 United States of America 37,524
34 India (Bhārat) 36,662
35 Nigeria 36,045
36 Honduras 33,334
37 Mali 22,016
38 Equatorial Guinea (Guinea Ecuatorial) 20,353
39 Gambia, The 18,731
40 Sweden 18,609

41 Lithuania (Lietuva) 18,473
42 Moldova, Republic of 17,129
43 Nicaragua 17,057
44 Norway (Norge) 15,396
45 Ghana 14,239
46 Ireland, Republic of (Éire) 13,840
47 Guinea (Guinée) 11,265
48 Denmark (Danmark) 11,264
49 Finland (Suomi) 11,063
50 Bangladesh 10,998

Population by foreign country of birth: 6,307,277
Total Population: 46,815,916
Source: INE (Spain), Census 2011


Top 50 Non-Spain Total In-flow by country of birth

Spain (España) 2017

1 Venezuela 51,050 9.59%
2 Morocco 40,717 7.65%
3 Colombia 37,472 7.04%
4 Romania 29,612 5.56%
5 United Kingdom 20,711 3.89%
6 Italy 18,683 3.51%
7 Honduras 18,426 3.46%
8 Peru 15,858 2.98%
9 Argentina 15,099 2.84%
10 Brazil 15,011 2.82%

11 Ecuador 14,457 2.72%
12 Dominican Republic 11,455 2.15%
13 China 11,182 2.10%
14 France 11,105 2.09%
15 Cuba 11,015 2.07%
16 Germany 8,772 1.65%
17 Paraguay 8,639 1.62%
18 Ukraine 7,929 1.49%
19 United States of America 7,874 1.48%
20 Russia 7,440 1.40%

21 Bolivia 7,411 1.39%
22 Pakistan 7,053 1.32%
23 Mexico 6,444 1.21%
24 Nicaragua 6,250 1.17%
25 Bulgaria 5,953 1.12%
26 Algeria 5,023 0.94%
27 India 4,909 0.92%
28 Portugal 4,768 0.90%
29 Senegal 4,539 0.85%
30 Chile 4,342 0.82%

31 Netherlands 3,960 0.74%
32 Belgium 3,857 0.72%
33 Uruguay 3,768 0.71%
34 Poland 3,166 0.59%
35 Philippines 2,974 0.56%
36 Bangladesh 2,113 0.40%
37 Sweden 1,994 0.37%
38 Switzerland 1,898 0.36%
39 Equatorial Guinea 1,806 0.34%
40 Moldova 1,600 0.30%

41 Ireland 1,577 0.30%
42 Nigeria 1,491 0.28%
43 The Gambia 1,434 0.27%
44 Ghana 1,300 0.24%
45 Lithuania 1,263 0.24%
46 Mali 1,149 0.22%
47 Norway 1,113 0.21%
48 Finland 1,066 0.20%
49 Denmark 824 0.15%
50 Guinea 787 0.15%
51 Mauritania 484 0.09%

Other European Union countries 5,204 0.98%
Other African countries 5,148 0.97%
Other countries of North America 891 0.17%
Other Central American and Caribbean countries 6,300 1.18%
Other South American countries 39 0.01%
Other Asian countries 11,461 2.15%
Oceania 926 0.17%
Total In-flow by country of birth (not net flow): 532,482
Net Migration: 164,604
of Spaniards -9,627
of foreign nationals 174,231
Source: INE (Spain)

Now we explore the largest metro area in Spain...
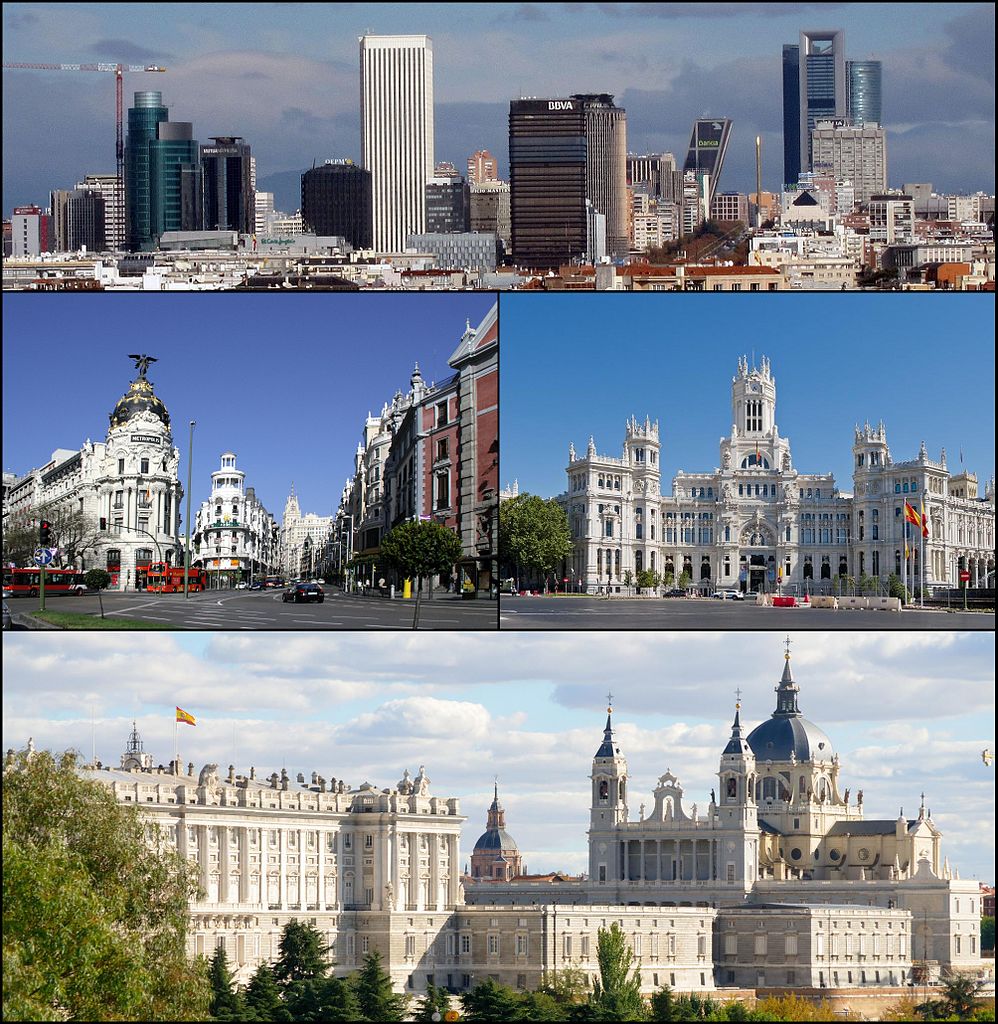

Image Source: wikimedia.org

Top 50 Non-Spain countries or places of birth

Madrid, Spain (España) 2011

1 Romania (România) 182,620
2 Ecuador 151,087
3 Morocco (Al Maghrib) 86,925
4 Colombia 86,713
5 Perú 84,428
6 Dominican Republic (República Dominicana) 55,643
7 Bolivia, Plurinational State of 41,774
8 China, People's Republic of 40,744
9 Argentine Republic (Argentina) 39,818
10 Venezuela, Bolivarian Republic of 29,245

11 Paraguay (Paraguáype) 25,764
12 Bulgaria (Balgariya) 25,464
13 France 25,293
14 Cuba 21,702
15 Poland (Polska) 20,829
16 Brasil 20,421
17 Ukraine 17,442
18 Germany (Deutschland) 16,883
19 Philippines (Pilipinas), Republic of the 15,924
20 Portugal 14,033

21 Chile 13,268
22 México (Estados Unidos Mexicanos) 12,807
23 Italy (Italia) 11,683
24 United Kingdom 11,674
25 United States of America 11,133
26 Equatorial Guinea (Guinea Ecuatorial) 8,190
27 Nigeria 7,508
28 Uruguay, Eastern Republic of 6,833
29 Honduras 6,759
30 Switzerland (Swiss Confederation) 6,162

31 Russian Federation (Russia) 6,103
32 Bangladesh 4,411
33 Belgium, Kingdom of 3,426
34 Sénégal 2,975
35 Netherlands (Nederland) 2,955
36 Pakistan 2,951
37 Nicaragua 2,881
38 Moldova, Republic of 2,852
39 India (Bhārat) 2,588
40 El Salvador 2,574

41 Algeria (Al Jaza'ir) 2,291
42 Guatemala 2,173
43 Mali 1,893
44 Guinea (Guinée) 1,718
45 Iran, Islamic Republic of 1,705
46 Cabo Verde 1,542
47 Sweden 1,525
48 Japan 1,522
49 Guinea-Bissau (Guiné-Bissau) 1,439
50 Syrian Arab Republic (Syria) 1,438

Population by foreign country of birth: 1,184,081
Metropolitan Area Population: 6,421,874

...and now we travel to the Catalan region and Spain's 2nd largest metro area...


Image Source: Everystockphoto

Top 50 Non-Spain countries or places of birth

Barcelona, Spain (España) 2011

1 Morocco (Al Maghrib) 131,580
2 Ecuador 82,612
3 Argentine Republic (Argentina) 48,079
4 Perú 47,930
5 Colombia 45,351
6 Bolivia, Plurinational State of 43,139
7 China, People's Republic of 37,071
8 Pakistan 34,926
9 Romania (România) 33,075
10 France 30,004

11 Dominican Republic (República Dominicana) 28,044
12 Italy (Italia) 19,859
13 Brasil 19,708
14 Chile 17,414
15 Uruguay, Eastern Republic of 16,923
16 Germany (Deutschland) 16,682
17 Venezuela, Bolivarian Republic of 15,636
18 Paraguay (Paraguáype) 13,267
19 Philippines (Pilipinas), Republic of the 13,247
20 Cuba 12,666

21 India (Bhārat) 11,886
22 United Kingdom 11,571
23 Russian Federation (Russia) 11,460
24 México (Estados Unidos Mexicanos) 10,025
25 Sénégal 9,657
26 Honduras 8,642
27 Ukraine 8,505
28 Portugal 8,263
29 Poland (Polska) 7,399
30 United States of America 6,919

31 Bulgaria (Balgariya) 5,628
32 Gambia, The 5,530
33 Netherlands (Nederland) 4,776
34 Bangladesh 4,492
35 Switzerland (Swiss Confederation) 4,376
36 Ghana 4,050
37 Nigeria 3,993
38 Algeria (Al Jaza'ir) 3,992
39 Georgia (Sak'art'velo) 3,229
40 Belgium, Kingdom of 3,110

41 Mali 3,109
42 El Salvador 2,824
43 Guinea (Guinée) 2,682
44 Armenia (Hayastan) 2,670
45 Sweden 2,299
46 Japan 2,034
47 Moldova, Republic of 1,987
48 Equatorial Guinea (Guinea Ecuatorial) 1,689
49 Nicaragua 1,602
50 Andorra, Principality of 1,552

Population by foreign country of birth: 901,409
Metropolitan Area Population: 5,522,565

...southwest we go to the 3rd largest in Spain that like Barcelona is situated along the Balearic Sea...


Image Source: gemeuroteam.org

Top 50 Non-Spain countries or places of birth

Valencia/València, Spain (España) 2011

1 Romania (România) 48,676
2 Ecuador 28,011
3 Morocco (Al Maghrib) 24,238
4 Colombia 23,709
5 France 22,169
6 Bulgaria (Balgariya) 18,966
7 Bolivia, Plurinational State of 16,646
8 Argentine Republic (Argentina) 14,785
9 United Kingdom 9,741
10 China, People's Republic of 9,122

11 Germany (Deutschland) 6,781
12 Ukraine 6,352
13 Algeria (Al Jaza'ir) 6,282
14 Uruguay, Eastern Republic of 6,272
15 Italy (Italia) 6,066
16 Pakistan 6,008
17 Venezuela, Bolivarian Republic of 5,637
18 Cuba 5,027
19 Brasil 4,797
20 Lithuania (Lietuva) 4,198

21 Perú 3,966
22 Poland (Polska) 3,329
23 Nigeria 3,287
24 Portugal 2,816
25 Sénégal 2,748
26 Russian Federation (Russia) 2,743
27 Switzerland (Swiss Confederation) 2,695
28 India (Bhārat) 2,613
29 Armenia (Hayastan) 2,496
30 Paraguay (Paraguáype) 2,419

31 Chile 2,362
32 Dominican Republic (República Dominicana) 2,307
33 Equatorial Guinea (Guinea Ecuatorial) 1,983
34 Honduras 1,815
35 México (Estados Unidos Mexicanos) 1,675
36 Belgium, Kingdom of 1,541
37 Netherlands (Nederland) 1,406
38 United States of America 1,406
39 Mali 1,342
40 Latvia (Latvija) 778

41 Georgia (Sak'art'velo) 643
42 Czech Republic (Česká Republika) 633
43 Guinea (Guinée) 623
44 Ghana 594
45 Slovak Republic (Slovenská republika/Slovakia) 566
46 Hungary (Magyarország) 540
47 Moldova, Republic of 539
48 Nicaragua 536
49 Syrian Arab Republic (Syria) 452
50 Ireland, Republic of (Éire) 444

Population by foreign country of birth: 334,381
Metropolitan Area Population: 2,563,342

...even further to the southwest of Spain we go to a city that is famous for its flamenco dancing (among other things)...


Image Source: European Best Destinations

Top 50 Non-Spain countries or places of birth

Sevilla, Spain (España) 2011

1 Morocco (Al Maghrib) 12,449
2 Romania (România) 11,029
3 Colombia 6,112
4 Bolivia, Plurinational State of 5,921
5 Germany (Deutschland) 4,962
6 Ecuador 4,677
7 France 4,205
8 China, People's Republic of 4,037
9 Perú 3,989
10 Argentine Republic (Argentina) 3,299

11 United Kingdom 2,629
12 Paraguay (Paraguáype) 2,337
13 Brasil 2,319
14 Portugal 1,995
15 Venezuela, Bolivarian Republic of 1,923
16 Russian Federation (Russia) 1,799
17 Dominican Republic (República Dominicana) 1,639
18 Italy (Italia) 1,636
19 Cuba 1,581
20 United States of America 1,377

21 Algeria (Al Jaza'ir) 1,331
22 Ukraine 1,280
23 Nigeria 1,276
24 Belgium, Kingdom of 1,138
25 Switzerland (Swiss Confederation) 1,137
26 México (Estados Unidos Mexicanos) 1,114
27 Nicaragua 917
28 Sénégal 797
29 Chile 746
30 Poland (Polska) 737

31 Bulgaria (Balgariya) 728
32 Netherlands (Nederland) 611
33 Uruguay, Eastern Republic of 610
34 Armenia (Hayastan) 437
35 Lithuania (Lietuva) 290
36 Philippines (Pilipinas), Republic of the 269
37 Honduras 261
38 El Salvador 241
39 Mauritania, Islamic Republic of 224
40 Ireland, Republic of (Éire) 192

41 Guatemala 189
42 India (Bhārat) 183
43 Georgia (Sak'art'velo) 177
44 Equatorial Guinea (Guinea Ecuatorial) 175
45 Syrian Arab Republic (Syria) 169
46 Pakistan 166
47 Japan 157
48 Sweden 149
49 Canada 142
50 Cameroon 133

Population by foreign country of birth: 99,320
Metropolitan Area Population: 1,930,941

...after a quick stop in Sevilla we travel on to a port city located on southern Spain’s Costa del Sol, known for its high-rise hotels and resorts jutting up from yellow-sand beaches...It's also quite popular with the British and that city is...


Image Source: bologna-airport.it

Top 50 Non-Spain countries or places of birth

Málaga, Spain (España) 2011

1 United Kingdom 55,710
2 Morocco (Al Maghrib) 42,088
3 Argentine Republic (Argentina) 22,428
4 Germany (Deutschland) 15,724
5 Romania (România) 13,041
6 France 9,517
7 Colombia 9,361
8 Paraguay (Paraguáype) 6,999
9 Ukraine 6,794
10 China, People's Republic of 5,847

11 Ecuador 5,842
12 Netherlands (Nederland) 5,619
13 Finland (Suomi) 5,261
14 Italy (Italia) 4,964
15 Brasil 4,600
16 Belgium, Kingdom of 4,333
17 Denmark (Danmark) 4,269
18 Bulgaria (Balgariya) 4,019
19 Russian Federation (Russia) 3,991
20 Sweden 3,860

21 Bolivia, Plurinational State of 3,767
22 Switzerland (Swiss Confederation) 3,498
23 Venezuela, Bolivarian Republic of 3,452
24 Nigeria 3,256
25 Uruguay, Eastern Republic of 2,939
26 Cuba 2,799
27 Ireland, Republic of (Éire) 2,277
28 Poland (Polska) 2,246
29 Philippines (Pilipinas), Republic of the 2,221
30 Portugal 2,221

31 Norway (Norge) 2,121
32 Chile 2,015
33 Sénégal 1,669
34 United States of America 1,636
35 Perú 1,584
36 India (Bhārat) 1,261
37 Dominican Republic (República Dominicana) 1,224
38 Algeria (Al Jaza'ir) 1,100
39 México (Estados Unidos Mexicanos) 961
40 Ghana 780

41 Iran, Islamic Republic of 742
42 Pakistan 740
43 Hungary (Magyarország) 709
44 Austria (Österreich) 631
45 Lithuania (Lietuva) 506
46 Canada 471
47 Moldova, Republic of 391
48 Nicaragua 391
49 Australia 372
50 Czech Republic (Česká Republika) 365

Population by foreign country of birth: 291,660
Metropolitan Area Population: 1,594,808

...and last but not least of our journey through Spain we arrive in Basque Country (Euskal Herria). It is a region that is quite famous for it's delicious cuisine but also for it's unique history, language and culture. The Basque (euskara) language is considered a language isolate (meaning there is no other known living language related to it) and the Basque people's ancestral homeland straddles the westernmost Pyrenees in adjacent parts of northern Spain and southwestern France.


Image Source: lunajets.com

Top 50 Non-Spain countries or places of birth

Bilbao-Bizkaia, Spain 2011

1 Romania (România) 9,167
2 Bolivia, Plurinational State of 9,141
3 Morocco (Al Maghrib) 6,226
4 Colombia 5,816
5 Paraguay (Paraguáype) 3,609
6 Brasil 2,849
7 China, People's Republic of 2,713
8 Ecuador 2,394
9 Portugal 2,056
10 Sénégal 1,906

11 Perú 1,707
12 Algeria (Al Jaza'ir) 1,692
13 Argentine Republic (Argentina) 1,342
14 Venezuela, Bolivarian Republic of 1,160
15 Nigeria 887
16 Cuba 852
17 Nicaragua 777
18 Pakistan 723
19 France 618
20 United Kingdom 579

21 Italy (Italia) 526
22 Dominican Republic (República Dominicana) 503
23 Germany (Deutschland) 440
24 Philippines (Pilipinas), Republic of the 428
25 Honduras 427
26 Cameroon 422
27 Equatorial Guinea (Guinea Ecuatorial) 405
28 Ghana 405
29 Chile 396
30 México (Estados Unidos Mexicanos) 375

31 Mali 355
32 Guinea-Bissau (Guiné-Bissau) 325
33 United States of America 314
34 Ukraine 308
35 Congo (Zaire), Democratic Republic of the 305
36 Uruguay, Eastern Republic of 303
37 Mauritania, Islamic Republic of 293
38 Russian Federation (Russia) 266
39 Angola 231
40 Georgia (Sak'art'velo) 226

41 Poland (Polska) 224
42 Bulgaria (Balgariya) 222
43 Moldova, Republic of 201
44 Guinea (Guinée) 193
45 Ireland, Republic of (Éire) 140
46 Nepal 131
47 Bangladesh 112
48 Congo, Republic of the 108
49 India (Bhārat) 103
50 Netherlands (Nederland) 97

Population by foreign country of birth: 70,752
Metropolitan Area Population: 1,156,190

Stay tuned for more! Sweden will be up next time around!
Reply With Quote
     
     
  #137  
Old Posted Oct 16, 2018, 2:47 AM
Urbanguy's Avatar
Urbanguy Urbanguy is offline
Go Beavs! Go Niners!
 
Join Date: Dec 2001
Location: Portland | Honolulu
Posts: 6,195
Off we go back to Viking Country -- the Nordic lands of Europe where we arrive in Sweden!

First, a little history about Sweden as brought to you by: sweden.se

"War, peace and progress

From 8,000 BC to 6,000 BC, Sweden as a whole became populated by people who lived by hunting, gathering and fishing, and who used simple stone tools. Dwelling places and graves dating from the Stone Age, lasting until about 1,800 BC, are found today in increasing numbers. The Bronze Age was marked in the Nordic region – especially in Denmark but also in Sweden – by a high level of culture, shown by the artifacts found in graves. After 500 BC, such artifacts become increasingly rare as iron came into more general use. During the early Iron Age, the population of Sweden became settled, and agriculture came to form the basis of the economy and society.

Vikings and early Christians

The Viking Age (800–1050 AD) was characterised by a significant expansion of activity, in Sweden’s case largely toward the east. Many Viking expeditions set off from Sweden to both plunder and trade along the Baltic coast and the rivers that stretched deep into present-day Russia. The Vikings traveled as far as the Black and Caspian Seas, where they developed trading links with the Byzantine Empire and the Arab kingdoms. Christianity first reached Sweden with a mission led by Ansgar, who visited in the 9th century, but the country was not converted to Christianity until the 11th century.
Founding of the kingdom

The various provinces of Sweden were absorbed around 1000 AD into a single unit, but the crown began to gain significant influence only during the late 13th century. In 1280 King Magnus Ladulås (1275–90) issued a statute authorising the establishment of a nobility and the organisation of society on the feudal model.
The Hanseatic period

Trade grew during the 14th century, especially with the German towns grouped under the leadership of Lübeck. By the mid-16th century, this group, known as the Hanseatic League, dominated Swedish trade, and many towns were founded as a result of lively commercial activity. However, the Black Death, which reached Sweden in 1350, led to a long period of economic and population decline.

The Kalmar Union

In 1389, the crowns of Denmark, Norway and Sweden were united under the rule of the Danish Queen Margareta. In 1397, the Kalmar Union was formed, with the three Scandinavian countries under a single monarch. However, the union (1397–1523) was scarred by internal conflicts that culminated in the ‘Stockholm Bloodbath’ in 1520, when 80 Swedish nobles were executed at the instigation of the Danish union king, Kristian II. The act provoked a rebellion, which in 1521 led to the deposition of Kristian II and the seizure of power by a Swedish nobleman, Gustav Vasa, who was elected king of Sweden in 1523.
The Vasa period

The foundations of the Swedish state were laid during the reign of Gustav Vasa (1523–60). The church was nationalised, its estates confiscated by the crown, and the Protestant Reformation was introduced. Power was concentrated in the hands of the king and hereditary monarchy came into force in 1544.
The Swedish empire

Since the dissolution of the Kalmar Union, Swedish foreign policy had been aimed at gaining dominion over the Baltic Sea, leading to repeated wars with Denmark from the 1560s onward. After Sweden intervened in 1630 with great success in the Thirty Years’ War on the side of the German Protestants, and Gustav II Adolf became one of Europe’s most powerful monarchs, Sweden defeated Denmark in the two wars of 1643–45 and 1657–58. Finland, provinces in northern Germany and the present-day Baltic republics also belonged to Sweden, and after the Peace of Westphalia in 1648 and the Peace of Roskilde with Denmark in 1658, Sweden was a great power in northern Europe. The country even founded a short-lived colony in what is now Delaware in North America. However, Sweden had a largely agrarian economy and lacked the resources to maintain its position as a great power in the long run.

After its defeat in the Great Northern War (1700–21) against the combined forces of Denmark, Poland and Russia, Sweden lost most of its provinces on the other side of the Baltic Sea and was reduced essentially to the same frontiers as present-day Sweden and Finland. During the Napoleonic Wars, Sweden surrendered Finland to Russia. As compensation, the French marshal Jean Baptiste Bernadotte, who had been elected heir to the Swedish throne in 1810, succeeded in obtaining Norway, which was forced into a union with Sweden in 1814. This union was peacefully dissolved in 1905 after many internal disputes.

18th/19th century Sweden

After the death of the warrior king Karl XII in 1718 and Sweden’s defeat in the Great Northern War, the Swedish parliament (Riksdag) and council were strong enough to introduce a new constitution that abolished royal absolutism and put power in the hands of parliament.

Eighteenth-century Sweden was characterised by rapid cultural development, partly through close contact with France. Overseas trade was hard hit by the Napoleonic Wars, which led to general stagnation and economic crisis in Sweden during the early 19th century. In the late 19th century, 90 per cent of the people still earned their livelihoods from agriculture.

One consequence was emigration, mainly to North America. From the mid-19th century to 1930, about 1.5 million Swedes emigrated, out of a population of 3.5 million in 1850 and slightly more than 6 million in 1930.

Industry did not begin to grow until the 1890s, although it then developed rapidly between 1900 and 1930 and transformed Sweden into one of Europe’s leading industrial nations after World War II."


The following statistics are a mixed bag, especially in regards to Swedish cities and the data was somewhat limited.


Image Source: wikimedia.org

Top 50 Non-Sweden countries or places of birth

Sweden 2017

1 Syrian Arab Republic (Syria) 172,258
2 Finland (Suomi) 150,877
3 Iraq 140,830
4 Poland (Polska) 91,180
5 Iran, Islamic Republic of 74,096
6 Somalia 66,369
7 Yugoslavia, former 65,877
8 Bosnia and Herzegovina 58,880
9 Germany (Deutschland) 50,863
10 Turkey (Türkiye) 48,299

11 Afghanistan, Islamic Republic of 43,991
12 Norway (Norge) 42,028
13 Thailand 41,240
14 Denmark (Danmark) 40,563
15 Eritrea (Ertra) 39,081
16 China, People's Republic of 31,333
17 India (Bhārat) 29,673
18 Romania (România) 29,546
19 Chile 27,996
20 United Kingdom 27,685

21 Lebanese Republic (Lebanon) 27,487
22 United States of America 20,990
23 Russian Federation (Russia) 20,930
24 Ethiopia 19,358
25 Vietnam (Việt Nam), Socialist Republic of 18,713
26 Greece (Hellenic Republic) 18,142
27 Hungary (Magyarország) 16,792
28 Pakistan 13,970
29 Philippines (Pilipinas), Republic of the 13,755
30 Lithuania (Lietuva) 13,659

31 Serbia (Srbija) 12,438
32 Italy (Italia) 12,419
33 Colombia 12,315
34 Netherlands (Nederland) 11,634
35 Spain (España) 11,632
36 Korea, Republic of (South) 11,093
37 France 10,650
38 Morocco (Al Maghrib) 10,474
39 Croatia (Hrvatska) 10,252
40 Estonia (Eesti) 10,214

41 Bulgaria (Balgariya) 9,457
42 Ukraine 8,842
43 Bangladesh 8,654
44 Kosovo (Kosova) 8,579
45 Brasil 8,466
46 Latvia (Latvija) 7,973
47 Perú 7,758
48 Macedonia (Makedonija), The former Yugoslav Republic of 7,731
49 Egypt, Arab Republic of 7,448
50 Palestinian Territories (Gaza Strip and West Bank) 7,365

Total Foreign-born: 1,877,050
Total Population: 10,120,242
Source: Statistics Sweden

*Sweden has quite a diverse immigrant population as many of the World's Major Regions are quite well represented from Europe, Africa, Asia, the Middle East to Latin America.

Top 50 Non-Sweden Net Immigrants by foreign country of birth

Sweden 2017

1 Syrian Arab Republic 22,028 21.77%
2 Afghanistan 9,155 9.05%
3 Iraq 5,900 5.83%
4 India 3,993 3.95%
5 Eritrea 3,906 3.86%
6 Iran (Islamic Republic of) 3,646 3.60%
7 Poland 2,795 2.76%
8 Somalia 2,464 2.43%
9 China (excluding Hong Kong) 1,740 1.72%
10 Romania 1,620 1.60%

11 Pakistan 1,520 1.50%
12 Turkey 1,447 1.43%
13 Ethiopia 1,442 1.42%
14 Thailand 1,365 1.35%
15 Germany 1,364 1.35%
16 United Kingdom 1,342 1.33%
17 Lithuania 1,316 1.30%
18 Serbia 1,294 1.28%
19 Greece 1,149 1.14%
20 United States of America 1,123 1.11%

21 Bosnia and Herzegovina 1,074 1.06%
22 Albania 1,062 1.05%
23 Viet Nam 1,009 1.00%
24 Croatia 941 0.93%
25 Ukraine 900 0.89%
26 Italy 884 0.87%
27 Bangladesh 856 0.85%
28 Kosovo 830 0.82%
29 Philippines 805 0.80%
30 Norway 791 0.78%

31 Russian Federation 775 0.77%
32 Spain 770 0.76%
33 Saudi Arabia 757 0.75%
34 Palestinian territory, occupied 746 0.74%
35 Sudan 713 0.70%
36 Lebanon 655 0.65%
37 Macedonia 655 0.65%
38 France 651 0.64%
39 Finland 649 0.64%
40 Egypt 648 0.64%

41 Kuwait 575 0.57%
42 Brazil 551 0.54%
43 Morocco 549 0.54%
44 Congo, the Democratic Republic of the 540 0.53%
45 Netherlands 538 0.53%
46 Mongolia 492 0.49%
47 United Arab Emirates 432 0.43%
48 Latvia 425 0.42%
49 Nigeria 382 0.38%
50 Bulgaria 359 0.35%

Net Immigrants by foreign country of birth 101,201
Source: Statistics Sweden

...and now we explore the largest city in Sweden...


Image Source: wikimedia.org

Top 30 Non-Sweden countries or places of birth

Stockholm City, Sweden 2017

1 Finland (Suomi) 16,803
2 Iraq 16,498
3 Poland (Polska) 12,084
4 Iran, Islamic Republic of 12,009
5 Syrian Arab Republic (Syria) 8,094
6 Somalia 7,946
7 Turkey (Türkiye) 7,479
8 United States of America 6,361
9 Eritrea (Ertra) 6,000
10 China, People's Republic of 5,876

11 India (Bhārat) 5,603
12 Chile 5,359
13 Germany (Deutschland) 5,290
14 United Kingdom 5,278
15 Ethiopia 5,062
16 Greece (Hellenic Republic) 4,796
17 Thailand 3,958
18 Yugoslavia, former 3,755
19 Afghanistan, Islamic Republic of 3,330
20 Bosnia and Herzegovina 3,317

21 France 3,311
22 Norway (Norge) 3,023
23 Romania (România) 2,958
24 Italy (Italia) 2,926
25 Morocco (Al Maghrib) 2,627
26 Spain (España) 2,601
27 Korea, Republic of (South) 2,104
28 Lebanese Republic (Lebanon) 1,974
29 Hungary (Magyarország) 1,848
30 Denmark (Danmark) 1,781

Total Foreign-born: 234,703
Total Population: 949,761


Image Source: wikimedia.org

Top 10 Non-Sweden countries or places of birth

Stockholm County (Stockholms län), Sweden 2017

1 Finland (Suomi) 50,268
2 Iraq 43,393
3 Poland (Polska) 35,319
4 Syrian Arab Republic (Syria) 29,055
5 Iran, Islamic Republic of 28,160
6 Turkey (Türkiye) 23,041
7 Germany (Deutschland) 12,699
8 Somalia 11,905
9 Eritrea (Ertra) 11,474
10 Thailand 10,352

Total Foreign-born: 571,904
Total Population: 2,308,143
*Limited data, Top 10 may not be accurate

After a brief stop in Stockholm off we go to the second-largest city in Sweden and the fifth-largest in the Nordic countries...


Image Source: wikimedia.org

Top 50 Non-Sweden countries or places of birth

Gothenburg (Göteborg), Sweden 2014

1 Iraq 11,872
2 Iran, Islamic Republic of 11,706
3 Somalia 6,912
4 Bosnia and Herzegovina 6,863
5 Finland (Suomi) 6,793
6 Yugoslavia, former 6,437
7 Poland (Polska) 5,757
8 Turkey (Türkiye) 4,441
9 Syrian Arab Republic (Syria) 3,361
10 China, People's Republic of 3,066

11 Germany (Deutschland) 2,832
12 Norway (Norge) 2,713
13 Lebanese Republic (Lebanon) 2,526
14 India (Bhārat) 2,460
15 Romania (România) 2,342
16 Chile 2,086
17 United Kingdom 2,083
18 Ethiopia 1,830
19 Vietnam (Việt Nam), Socialist Republic of 1,813
20 Thailand 1,788

21 Denmark (Danmark) 1,751
22 Afghanistan, Islamic Republic of 1,546
23 Hungary (Magyarország) 1,526
24 United States of America 1,397
25 Macedonia (Makedonija), The former Yugoslav Republic of 1,286
26 Russian Federation (Russia) 1,133
27 Greece (Hellenic Republic) 1,114
28 Croatia (Hrvatska) 1,042
29 Eritrea (Ertra) 1,042
30 Philippines (Pilipinas), Republic of the 1,014

31 Italy (Italia) 978
32 France 975
33 Spain (España) 846
34 Pakistan 838
35 Morocco (Al Maghrib) 773
36 Korea, Republic of (South) 756
37 Colombia 741
38 Serbia (Srbija) 733
39 Nigeria 689
40 Portugal 675

41 Brasil 645
42 Bolivia, Plurinational State of 625
43 Bulgaria (Balgariya) 585
44 Iceland (Ísland) 580
45 Palestinian Territories (Gaza Strip and West Bank) 536
46 Estonia (Eesti) 526
47 Netherlands (Nederland) 517
48 Gambia, The 490
49 Serbia and Montenegro, former 468
50 Ukraine 412

Total Foreign-born: 129,964
Total Population: 541,145
Source: SCB (OSDB)


Image Source: wikimedia.org

Top 10 Non-Sweden countries or places of birth

Greater Gothenburg (Stor-Göteborg), Sweden 2017

1 Iraq 16,078
2 Iran, Islamic Republic of 15,718
3 Finland (Suomi) 10,686
4 Syrian Arab Republic (Syria) 10,479
5 Poland (Polska) 9,283
6 Somalia 9,198
7 Bosnia and Herzegovina 9,023
8 Yugoslavia, former 8,243
9 Turkey (Türkiye) 5,356
10 Norway (Norge) 4,947

Total Foreign-born: 200,232
Total Population: 1,012,569
*Limited data, Top 10 may not be accurate

...last but not least we arrive in the capital and largest city of the Swedish county of Skåne County. The metropolis is a gamma world city (as listed by the GaWC), the third-largest city in Sweden, after Stockholm and Gothenburg...


Image Source: wikimedia.org

Top 10 Non-Sweden countries or places of birth

Greater Malmö (Stor-Malmö), Sweden 2017

1 Iraq 15,087
2 Poland (Polska) 12,113
3 Denmark (Danmark) 12,018
4 Yugoslavia, former 11,411
5 Syrian Arab Republic (Syria) 9,842
6 Bosnia and Herzegovina 8,490
7 Iran, Islamic Republic of 5,888
8 Afghanistan, Islamic Republic of 5,227
9 Germany (Deutschland) 4,781
10 Finland (Suomi) 3,554

Total Foreign-born: 172,456
Total Population: 719,185
*Limited data, Top 10 may not be accurate

Time to pack our bags because we are going to Africa next!
Reply With Quote
     
     
  #138  
Old Posted Oct 16, 2018, 3:13 AM
Urbanguy's Avatar
Urbanguy Urbanguy is offline
Go Beavs! Go Niners!
 
Join Date: Dec 2001
Location: Portland | Honolulu
Posts: 6,195
From Europe to Africa we now enter the country of Tanzania!

..as usual, a little history about Tanzania as brought to you by: tanzaniatourism.go.tz

"It is believed that modern humans originate from the rift valley region of East Africa, and as well as fossilized hominid remains, archaeologists have uncovered Africa's oldest human settlement in Tanzania.

Early History
In 1959, Dr. L. S. B. Leakey, a British anthropologist, discovered at Olduvai Gorge in NE Tanzania the fossilized remains of what he called Homo habilis, who lived about 1.75 million years ago. Tanzania was later the site of Paleolithic cultures. By the beginning of the first millennium A.D. scattered parts of the country, including the coast, were thinly populated. At this time overseas trade seems to have been carried out between the coast and NE Africa, SW Asia, and India.

By about A.D. 900 traders from SW Asia and India had settled on the coast, exchanging cloth, beads, and metal goods for ivory. They also exported small numbers of Africans as slaves. By this time there were also commercial contacts with China, directly and via Sri Vijaya (see under Indonesia) and India. By about 1200, Kilwa Kisiwani (situated on an island) was a major trade center, handling gold exported from Sofala (on the coast of modern Mozambique) as well as goods (including ivory, beeswax, and animal skins) from the near interior of Tanzania. By about 1000 the migration of Bantu-speakers into the interior of Tanzania from the west and the south was well under way, and the population there had been greatly increased. The Bantu were organized in relatively small political units.

Foreign Contacts
In 1498, Vasco da Gama, the Portuguese explorer, became the first European to visit the Tanzanian coast; in 1502, on his second visit there, he made Kilwa tributary. In 1505, Kilwa was sacked by Francisco d’Almeida, another Portuguese explorer, and by 1506 Portugal controlled most of the coast of E Africa. The Portuguese did not cooperate with the local people, and their impact was mostly negative—trade was disrupted, towns declined, and people migrated from the region. However, Kilwa’s trade seems to have grown as a result of contact with the Portuguese. Toward the end of the 16th cent., the Zimba, a group from SE Africa, moved rapidly up the coast, causing considerable damage; in 1587 they sacked Kilwa and killed about 3,000 persons (roughly 40% of its inhabitants).

In 1698 the Portuguese were expelled from the E African coast (except for a brief return in 1725) with the help of Arabs from Oman. In the early 18th cent., the Omanis showed some interest in the commerce of E Africa, and this increased after the Bu Said dynasty replaced the Yarubi rulers in 1741. Oman’s commercial activity was centered on Zanzibar (and, to a lesser extent, at Mombasa), from which it controlled the overseas trade of E Africa. By the early 19th cent. numerous towns on the Tanzanian coast had been founded or revived; these included Tanga, Pangani, Bagamoyo, Kilwa Kivinje (situated on the mainland near Kilwa Kisiwani), Lindi, and Mikandani.

Colonialism
As the scramble for African territory among the European powers intensified in the 1880s, Carl Peters and other members of the Society for German Colonization signed treaties with Africans (1884–85) in the hinterland of the Tanzanian coast. By an agreement with Great Britain in 1886, Germany established a vague sphere of influence over mainland Tanzania, except for a narrow strip of land along the coast that remained under the suzerainty of the sultan of Zanzibar, who leased it to the Germans. The German East Africa Company (founded 1887) governed the territory, called German East Africa. The company’s aggressive conduct resulted in a major resistance movement along the coast by Arabs, Swahili (whose main leaders were Abushiri and Bwana Heri), and other Africans that was only defeated with the help of the German government. A second Anglo-German agreement (1890) added Rwanda, Burundi, and other regions to German East Africa.

Because the company had proved to be an ineffective ruler, the German government in 1891 took over the country (which by then included the coast) and declared it a protectorate. However, it was not until 1898, with the death of the Hehe ruler, Mkwawa, who strongly opposed European rule, that the Germans succeeded in controlling the country. During the period 1905 to 1907 the Maji Maji revolt against German rule engulfed most of SE Tanzania; about 75,000 Africans lost their lives as a result of German military campaigns and lack of food. Under the Germans, several new crops (including sisal, cotton, and plantation-grown rubber) were introduced; the production and sale of other commodities (notably coffee, copra, sesame, and peanuts) was encouraged, and railroads were built to Kigoma on Lake Tanganyika and to Moshi. In addition, many new Christian missions, which included rudimentary schools for the Africans, were established.

During World War I, British and Belgian troops occupied (1916) most of German East Africa. In the postwar period the League of Nations made Tanganyika a British mandate, and Ruanda-Urundi (later Rwanda and Burundi), a Belgian mandate; the Portuguese gained control of some land in the southeast. The British, especially during the administration (1925–31) of Gov. Sir Donald Cameron, attempted to rule “indirectly” through existing African leaders. However, unlike N Nigeria, where the policy of indirect rule was first developed (see Frederick Lugard), Tanganyika had few indigenous large-scale political units. Therefore, African leaders had to be established in newly defined constituencies. The effect of British policy, as a result, was to alter considerably the patterns of African life in Tanganyika. After a slow start, the British developed the territory’s economy largely along the lines established by the Germans. Increasing numbers of Africans worked for a wage on plantations, especially after 1945, when economic growth began to accelerate. Also after 1945 Africans gradually gained more seats on the territory’s legislative council (which had been established in 1926).

Independence and Nyerere
In 1954, Julius Nyerere and Oscar Kambona transformed the Tanganyika African Association (founded in 1929) into the more politically oriented Tanganyika African National Union (TANU). TANU easily won the general elections of 1958–60, and when Tanganyika became independent on Dec. 9, 1961, Nyerere became its first prime minister. In Dec., 1962, Tanganyika became a republic within the Commonwealth of Nations, and Nyerere was made president. On Apr. 26, 1964, shortly after a leftist revolution in newly independent Zanzibar, Tanganyika and Zanzibar merged; Nyerere became the new country’s first president. Abeid Amani Karume, the head of Zanzibar’s government and leader of its dominant Afro-Shirazi party (ASP), became Tanzania’s first vice president. Although formally united with the mainland, Zanzibar retained considerable independence in internal affairs.

In Feb., 1967, Nyerere issued the Arusha Declaration, a major policy statement that called for egalitarianism, socialism, and self-reliance. It promised a decentralized government and a program of rural development called ujamaa (“pulling together”) that involved the creation of cooperative farm villages. Factories and plantations were nationalized, and major investments were made in primary schools and health care. While Nyerere put some of the declaration’s principles into practice, it was not clear if power in Tanzania was, in fact, being decentralized.

TANU was the mainland’s sole legal political party and it was tightly controlled by Nyerere. In the early 1970s there was tension (and occasional border clashes) between Tanzania and Uganda, caused mainly by Nyerere’s continued support of Uganda’s ousted president, A. Milton Obote. However, in 1973, Nyerere and Gen. Idi Amin, Uganda’s new head of state, signed an agreement to end hostilities. Tanzania supported various movements against white-minority rule in S Africa, and several of these organizations had offices in Dar-es-Salaam. In 1977, TANU and Zanzibar’s ASP merged to form the Party of the Revolution (CCM). A new constitution was adopted the same year.

Hostilities with Uganda resumed in 1978 when Ugandan military forces occupied about 700 sq mi (1800 sq km) of N Tanzania and left only after having caused substantial damage. One month later, Tanzanian forces and Ugandan rebels staged a counterinvasion. Tanzania captured the Ugandan capital of Kampala in 1979 and drove Idi Amin from power. This campaign further depleted the country’s already scarce economic resources. Tanzania maintained troops in Uganda after its victory and drew criticism from other African nations for its actions. In 1983, negotiations between Kenya, Tanzania, and Uganda led to the reopening of the Kenyan border, which had been closed since 1977 after the collapse of the East African Community.

Tanzania after Nyerere
By the 1980s, it was clear that the economic policies set out by the Arusha Declaration had failed. The economy continued to deteriorate with cycles of alternating floods and droughts, which reduced agricultural production and exports. After Nyerere resigned as promised in 1985, Ali Hassan Mwinyi, president of Zanzibar, became head of the one-party government. He began an economic recovery program involving cuts in government spending, decontrol of prices, and encouragement of foreign investment; modest growth resumed. In 1992 the constitution was amended to allow opposition parties.

The 1995 multiparty elections, which were regarded by international observers as seriously flawed, were won by Benjamin William Mkapa, candidate of the ruling CCM. In the 1990s Tanzania was overwhelmed by refugees from the war in neighboring Burundi; by the end of the decade some 300,000 were in Tanzania, and the number subsequently grew. Tanzania began repatriating the refugees in 2002, and closed the last camp in 2009. More than 200,000 Burundian refugees who fled to Tanzania in 1972 also remained prior to 2009; many of these accepted an offer of Tanzania citizenship.

Mkapa, who continued to pursue economic reforms, was reelected in 2000, but there were blatant irregularities in the vote in Zanzibar, where the opposition party, which favors greater independence for the island, had been expected to do well. In 2005 the CCM candidate for president, Jakaya Kikwete won the election with 80% of the vote, and the CCM won more than 90% of the seats in parliament, but the voting in Zanzibar was again marred by violence and irregularities. A corruption investigation implicated the prime minister, Edward Lowassa, and two other cabinet members in 2008, leading them to resign in February; Kikwete subsequently re-formed the cabinet. The president was reelected in 2010 with more than 60% of the vote, while on Zanzibar the election was largely peaceful and the CCM candidate narrowly won the island’s presidency. The CCM also won three quarters of the seats in parliament."


Image Source: wikimedia.org

Top 20 Non-Tanzania countries or places of citizenship

Tanzania 2012

1 Burundi 233,606
2 Congo (Zaire), Democratic Republic of the 99,858
3 Kenya 59,236
4 India (Bhārat) 41,097
5 Rwanda 24,947
6 China, People's Republic of 22,542
7 United Kingdom 19,186
8 Uganda 18,524
9 Mozambique (Moçambique) 17,424
10 United States of America 17,113

11 Malawi 12,226
12 Zambia 10,975
13 Germany (Deutschland) 7,795
14 South Africa, Republic of 7,698
15 Nordic Countries 6,138
16 Italy (Italia) 5,807
17 Canada 3,752
18 Somalia 3,514
19 Pakistan 2,995
20 Zimbabwe 2,967

Total foreign country of citizenship: 662,827
Total Population: 44,928,923
Source: Tanzania National Bureau of Statistics, Census 2012

...now we explore the largest city in Tanzania...


Image Source: [email protected]

Top 20 Non-Tanzania countries or places of citizenship

Dar es Salaam Region, Tanzania 2012

1 India (Bhārat) 10,886
2 Malawi 5,919
3 Kenya 4,058
4 China, People's Republic of 2,376
5 United Kingdom 2,152
6 United States of America 1,615
7 Congo (Zaire), Democratic Republic of the 1,334
8 Pakistan 1,186
9 Uganda 929
10 South Africa, Republic of 839

11 Germany (Deutschland) 681
12 Nordic Countries 680
13 Mozambique (Moçambique) 580
14 Somalia 522
15 Zambia 522
16 Canada 476
17 Zimbabwe 436
18 Italy (Italia) 316
19 Rwanda 291
20 Burundi 249

Total foreign country of citizenship: 41,987
Total Population: 4,364,541

*You may or may not be surprised but many countries like Tanzania, Kenya, Uganda, Zimbabwe and Mozambique had fairly significant South Asian populations -- many of which have emigrated (in some cases forced to leave) and moved to countries like the UK, Canada, Australia and the United States.

I do find the Chinese & Italian populations as quite a surprise and interesting to see.

After a visit to Tanzania it's back to Europe to a small European country, surrounded by Belgium, France and Germany -- Luxembourg!

First is a little history of Luxembourg as brought to you by: luxembourg.public.lu

"The history of Luxembourg goes back to 963, when Count Sigfried acquired the small fort called Lucilinburhuc in an exchange with St Maximin's Abbey in Trier. The fort stood on the rocky spur of the Bock, dominating the Alzette valley.

During the Middle Ages, the Princes of Luxembourg wore the crown of the Holy Roman Empire.

Henri VII, Count of Luxembourg, was elected King of Germany in 1308 and crowned as Emperor four years later in Rome. The Counts of Luxembourg also became Kings of Bohemia by the marriage of John the Blind, son of Henri VII, to Elisabeth, heiress to the kingdom of Bohemia. John the Blind was a model knight, and died a hero’s death in the service of the King of France at the Battle of Crécy in 1346. In 1364, with the definitive acquisition of the County of Chiny, the possessions of the Dukes of Luxembourg covered the largest area in their history (10,000 square kilometres). After Henri VII, three other members of the Luxembourg dynasty were to wear the royal or imperial crowns in succession: Charles IV (1346-1378), Wenceslas (1376-1400) and Sigismund (1410-1437), the last Emperor from the House of Luxembourg. In modern times, Luxembourg's fortress, referred to as 'Gibraltar of the North', was a focal point in the struggles among the major powers. Before obtaining its independence during the 19th century, Luxembourg lived under successive Burgundian, Spanish, French, Austrian and Dutch sovereignty.

1795 Luxembourg was annexed to France, becoming the 'Département des Forêts' under Napoleon

1815-1890 Creation of the current Grand Duchy of Luxembourg

After the collapse of the Napoleonic Empire, the map of Europe was redrawn and divided up among the major powers, meeting at the Congress of Vienna in 1815. This was when Luxembourg was created as an independent political entity. It was made a Grand Duchy, and attributed to the King of the Netherlands, William I of Orange-Nassau. Despite this rise in status, the Grand Duchy was obliged to cede to Prussia the Eifel area and a vast area to the east of the Moselle, Sûre and Our rivers.

It was not until 1839, with the Treaty of London, that the Grand Duchy took on its present day form. The Grand Duchy of Luxembourg remained under the sovereignty of the House of Orange-Nassau, but acquired its own administration, and the Belgian part of Luxembourg became a province of Belgium.

1890 The personal union with the Netherlands did not end until 1890, with the death of William III. Adolphe of Nassau-Weilbourg became Grand Duke of Luxembourg. The country then had its own dynasty.

20th century

The end of neutrality, and the Grand Duchy's role in the construction of Europe

Despite its neutrality, the Grand Duchy was invaded by the German army during both World Wars, on 2 August 1914 and 10 May 1940. During the second invasion, Grand Duchess Charlotte and the government went into exile and the country was subjected to occupation by the Nazis. On 10 September 1944, Luxembourg City was liberated by American troops. During the Ardennes offensive (the Battle of the Bulge), German forces devastated the north and east of the country (between December 1944 and February 1945). After the Second World War, the Grand Duchy abandoned neutrality and took its place in the international community which came into being after 1945. It is a founding member of the UN (1945), Benelux (1947), NATO (1949), the ECSC (1951), the EEC and Euratom (Treaties of Rome) (1958), etc. The accession to the throne of Grand Duke Jean in 1964 coincided with an era of exceptional prosperity. Grand Duke Jean abdicated in 2000 in favour of his son, Henri. 2014 marks the 175th anniversary of the Grand Duchy's independence."


Image Sources: wikimedia.org & dispatcheseurope.com

Top 20 Non-Luxembourg countries or places of birth

Luxembourg 2011

1 Portugal 60,897
2 France 28,080
3 Belgium, Kingdom of 16,789
4 Germany (Deutschland) 14,803
5 Italy (Italia) 13,223
6 Cabo Verde 4,622
7 United Kingdom 4,223
8 Netherlands (Nederland) 3,503
9 Spain (España) 2,914
10 Poland (Polska) 2,882

11 Montenegro (Crna Gora) 2,847
12 Bosnia and Herzegovina 2,232
13 Kosovo (Kosova) 1,961
14 Romania (România) 1,927
15 China, People's Republic of 1,869
16 Brasil 1,795
17 Serbia (Srbija) 1,754
18 United States of America 1,626
19 Denmark (Danmark) 1,519
20 Sweden 1,374

Total Foreign-born: 206,132
Total Population: 512,353
Source: Statistics Portal (Grand-Duchy of Luxembourg), Census 2011

....and finally we arrive at our last stop of our journey tonight in the Caribbean and the islands of Trinidad and Tobago!

A little history of T&T by: thecommonwealth.org

"Until 1888, Trinidad and Tobago were separate territories. Both have a history of repeated invasion and conquest by competing European powers.

Trinidad, named Iere (probably meaning ‘humming bird’) by the Arawak inhabitants, was claimed for the Spanish Crown by Christopher Columbus in 1498. The embattled Spanish colony that developed was raided by the English, Dutch and French through the 17th century. Large-scale importation of African slaves enabled a plantation economy to develop. French Haitians (who were offered incentives by the Spanish Crown) swelled the settler population.

In 1797, the island surrendered to a British expedition and became a British Crown colony in 1802. Slaves were emancipated in 1834, free trade adopted in 1846, and more than 150,000 immigrants from India, China and Madeira brought in between 1845 and 1917. These indentured labourers came on short contracts, after which they were free to return home or buy plots of land. The Indians worked mainly on the sugar plantations of the Caroni and Naparima plains and introduced the cultivation of rice there.

Tobago’s name derives from the Carib word Tavaco, the pipe in which the Amerindians smoked tobacco leaves, and was inhabited by Caribs at the time of Columbus’s visit in 1498. These people had all been killed by 1632 when 300 Dutch settlers arrived. Further Dutch and French settlers followed. Tobago changed hands more frequently between 1650 and 1814 than any other Caribbean territory – ownership shifting from a settler (Cornelius Lampsius, declared owner and Baron of Tobago by Louis XIV of France) to the Duke of Courland, to a company of London merchants, to neutral status in 1748, to the English Crown by the Treaty of Paris of 1763.

Even then, Tobago was fought over. The French captured it in 1781; the British took it back in 1793; the French regained it through the Treaty of Amiens (1802), but it was returned to the British in 1814. Despite these battles, Tobago was prosperous until its sugar industry was weakened by the abolition of slavery, a hurricane, the decline of West Indian sugar in general and the Belmanna riots. No longer viable as a separate colony, it was amalgamated with the larger island of Trinidad in 1888.

The Spanish constitution was retained after Trinidad became a British Crown colony in 1802. The Governor was assisted by a council of advice and a cabildo elected by the taxpayers. The council of advice evolved into the nominated legislative council and the cabildo became Port of Spain’s town council. When Tobago was amalgamated with Trinidad in 1888, the laws of Trinidad were extended to the smaller island and, after a period, the revenues of the two islands were merged and Tobago’s debt to Trinidad cancelled. Tobago was administered by a commissioner (later a warden) appointed by the colony’s Governor.

In the 1920s, the labour movement organised trade unions, and pressure increased for greater local democracy and then independence. A new constitution brought a limited form of electoral representation to Trinidad for the first time (Tobago had had elections before). But only seven of the 25 members were elected, and high property and language qualifications limited the vote. This did not satisfy the growing demand for political expression, which led to the 1937 labour disturbances, an increase in the number of elected members in 1941 and, in 1945, universal adult suffrage.

In 1950, the constitution was redrawn, providing for a legislative council of 26 members, 18 of them elected; a policy-making executive council of nine (five elected by the legislative council), and a rudimentary ministerial system. Further constitutional changes followed, and by 1959, the legislative council had more elected members and an elected Speaker, and the ministerial system had developed into a cabinet elected from the legislative council. The Governor’s powers were circumscribed: he did not normally chair cabinet meetings, and had to act in accordance with the cabinet’s advice.

The 1956 elections gave the majority to the People’s National Movement (PNM), led by Dr Eric Williams. Williams instituted further constitutional talks with the UK in 1959–60, resulting in full internal self-government and a bicameral legislature (nominated Senate and elected House of Representatives). The general election of 1961 was again won by the PNM, which implemented the new constitution.

In 1958 Trinidad and Tobago became a co-founder of the Federation of the West Indies, which aimed to become an independent country, but Jamaica withdrew in 1961, and Trinidad and Tobago also decided to seek its own independence. Further constitutional talks with the UK began, and a draft constitution was drawn up after much consultation. The country became independent in August 1962, and a republic in 1976.

In July 1990, an attempted coup was staged by a militant Muslim faction, which stormed parliament and took Robinson and members of parliament hostage for five days and led to an outbreak of looting in poor areas of the capital. The hostages were released on the promise of an amnesty, but the NAR government was never able to recover and the PNM, under Patrick Manning, won an easy electoral victory in December 1991.

In the December 2000 general election, the UNC was re-elected, winning 19 of the 36 elected seats, while PNM took 16 and NAR one; Panday continued as Prime Minister. However, the PNM immediately challenged the result on the grounds that two UNC candidates had had dual nationality. There was further controversy when the President was unwilling to appoint seven of Panday’s nominations to cabinet posts who had all been defeated in the elections.

President Robinson finally gave way in February 2001 but the PNM’s challenge to the legitimacy of the two UNC members took far longer to resolve and the new administration continued in 2001 amid considerable uncertainty, which was only dispelled when a fresh national election was called for December 2001."


Image Source: wikimedia.org

Top 10 Non-Trinidad and Tobago countries or places of birth

Trinidad and Tobago 2011

1 Guyana 9,626
2 Grenada (Camerhogne) 7,851
3 Saint Vincent and the Grenadines 6,296
4 United States of America 5,677
5 United Kingdom 2,319
6 Canada 1,741
7 Venezuela, Bolivarian Republic of 1,696
8 Jamaica 1,466
9 Barbados 1,044
10 India (Bhārat) 940

Total Foreign-born: 48,783
Total Population: 1,322,546
Source: Central Statistical Office (T&T), Census 2011

We've got Belgium, Chile, Denmark, Argentina, Finland and others to come! So stay tuned for more!!!
Reply With Quote
     
     
  #139  
Old Posted Oct 16, 2018, 3:29 AM
Urbanguy's Avatar
Urbanguy Urbanguy is offline
Go Beavs! Go Niners!
 
Join Date: Dec 2001
Location: Portland | Honolulu
Posts: 6,195
Quote:
Originally Posted by Jonesy55 View Post
So at 3.5% foreign born is Pittsburgh the least international major metro area in the US/Canada?
It's tied with Birmingham, Alabama both of which are at 3.5% but as for metro areas over 1 million on up those do appear to be the least "international" in terms of foreign-born populations. It seems so unusual to see but there are still places in the U.S. that are attracting very few immigrants.
Reply With Quote
     
     
  #140  
Old Posted Oct 16, 2018, 5:43 AM
bnk bnk is offline
BANNED
 
Join Date: Mar 2006
Location: chicagoland
Posts: 12,071
Are you sure those number of Japanese for Chicagoland is right?


As of the 2000 U.S. Census, 5,500 people of Japanese descent lived in the city of Chicago, and 17,500 people of Japanese descent lived in Chicago suburbs such as Arlington Heights, Evanston, Hoffman Estates, Lincolnwood, and Skokie. Most Japanese within the City of Chicago live in lakefront areas in the North Side, including Edgewater, Lake View, Near North Side, Uptown, and West Ridge.


https://en.wikipedia.org/wiki/Japanese_in_Chicago

Last edited by bnk; Oct 16, 2018 at 5:59 AM.
Reply With Quote
     
     
This discussion thread continues

Use the page links to the lower-right to go to the next page for additional posts
 
 
Reply

Go Back   SkyscraperPage Forum > Discussion Forums > City Discussions
Forum Jump


Forum Jump


All times are GMT. The time now is 3:21 PM.

     
SkyscraperPage.com - Privacy Statement - Top

Powered by vBulletin® Version 3.8.7
Copyright ©2000 - 2026, vBulletin Solutions, Inc.