HomeDiagramsDatabaseMapsForum About
     

Go Back   SkyscraperPage Forum > Discussion Forums > City Discussions


Reply

 
Thread Tools Display Modes
     
     
  #101  
Old Posted Oct 10, 2018, 2:29 AM
Urbanguy's Avatar
Urbanguy Urbanguy is offline
Go Beavs! Go Niners!
 
Join Date: Dec 2001
Location: Portland | Honolulu
Posts: 6,195
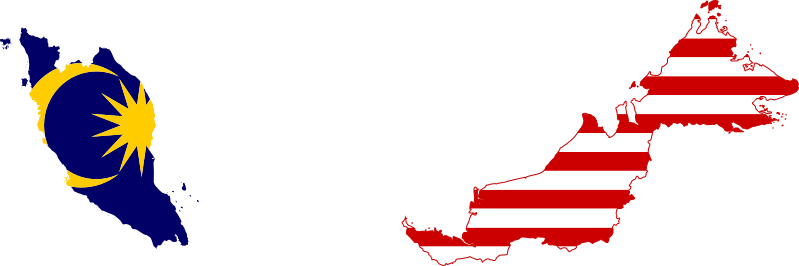
Off we go to our last stop for the night -- even further to the east than where we started today and that is Malaysia!

Before we begin, here is a brief history of Malaysia according to: wonderfulmalaysia.com

"About 10.000 years ago, the Orang Asli (comparable to Malay Aboriginals) left from southwest China to the peninsula we now call West-Malaysia. Until 1405 the following superpowers reigned over the peninsula; the Funan (Cambodia), the Srivijaya (Sumatra) and the Majapahit (Java). From 1405 onwards the Chinese influence in this area grew. In this period the Islamic way of thinking also set in when Arabic traders arrived. In a short period of time many people converted to this religion. From 1500 on the trade in Southeast Asia increased enormously. The European superpowers of that time acquired interest in the local resources, the era of trade over sea had started and Malaysia would play a big part in it.

Malaysia under British ruling

The Portuguese were the first to occupy Malacca (partly due to its perfect location). During the VOC-era (later the Dutch East Indies era) the Dutch seized power in Malacca in 1641. At first, the British didn't put much effort into Malacca, and established themselves on the island Penang (1786). Only until 1795 the British took over command of the Dutch in Malacca, who started focusing more on trade all around Indonesia. It is said the Dutch traded 'Malaysia' for 'Indonesia'. The British Crown Colony (also referred to as the Straits Settlements) was established in 1826 and slowly but certain, the British increased their power over the rest of the peninsula. At first, it was primarily spices taken from the present Malaysia. But when in the early 19th century tin supplies were discovered, the trade shifted rapidly.

The British first colonized the peninsula and after that, between 1840 an 1882, also annexated east-Malaysia (Sabah and Sarawak) into the British Crown Colony. In this period, the British also invited many Indian people to Malaysia, to fill up the shortage of workers. After the Japanese occupation during World War II, the strive for independence grew among Malay people, this lead to a communist insurrection (1948-1960); 'The Emergency'. In 1948 the Federation of Malaya was founded. The Federation consisted of 11 states; nine Malay states and the British settlements of Penang and Malacca.

Federation of Malaysia

In 1957 the British surrendered their sovereignty over Malaysia and the peninsula became independent that year with the name 'Federation of Malaysia'. A new federation with the name Malaysia was established on September 16th 1963 by the unity of Malaysia, Singapore and the east-Malaysian states Sabah and Sarawak on the north coast of Borneo. Directly after this, the Filipinos and Indonesia broke all their diplomatic relations, because they believed that some of these parts belonged to them. Indonesia started with the konfrontasi (confrontation); fishing-boats in front of Sarawak's coast were brought to sink and above Sabah the roaring of airplanes could be heard. But after Soekarnos disposal in 1966, the government made a treaty of peace with Malaysia and after that the Filipinos dropped their territory claims on Sabah too (though up to this day there is still an interest in the northern parts of Sabah).

In 1965 Singapore separated from the federation and became an independent state. The sultan of the oil state Brunei (located between the federal states Sabah and Sarawak), already made clear in the past that they opposed to any kind of unity with Malaysia.

After the declaration of independence in 1957 Malaysia has developed itself quickly. With the 'Vision 2020' strategy carried out by former premier Mahathir, Malaysia jumps ahead as a economically and technologically well developed country. Last couples of years have been dominated by political disturbances. Two unauthorized anti-government rallies shook Malaysia's fundaments in November 2007. The first rally was organized to protest over corruption in the Malaysian electoral system. The second rally was organized by the Hindu Rights Action Force, to protest over discrimination against non-ethnic Malays (mainly Indian immigrants). Both rallies were condemned by the government and were put down fierce by the police. However, these rallies were the start of more political shifts."


Image Source: wikimedia.org

Top 10 Non-Malaysia countries or places of citizenship

Malaysia 2010

1 Indonesia 1,123,542
2 Philippines (Pilipinas), Republic of the 350,483
3 Bangladesh 130,062
4 Myanmar (Burma) 88,427
5 India (Bhārat) 75,673
6 Nepal 71,131
7 China, People's Republic of 59,032
8 Thailand 49,792
9 Vietnam (Việt Nam), Socialist Republic of 28,956
10 Pakistan 24,215

Total foreign country of citizenship: 2,402,614
Total Population: 27,484,596
Source: Department of Statistics Malaysia, Census 2010

...next up is a little venture into the largest and most well-known city in Malaysia and that is...


Image Source: wikimedia.org

Top 10 Non-Malaysia countries or places of citizenship

Kuala Lumpur (Federal Territory/City), Malaysia 2010

1 Indonesia 48,802
2 India (Bhārat) 14,581
3 Myanmar (Burma) 8,736
4 China, People's Republic of 7,898
5 Bangladesh 7,323
6 Pakistan 3,188
7 Japan 2,818
8 Philippines (Pilipinas), Republic of the 2,613
9 Thailand 1,688
10 Nepal 1,590

Total foreign country of citizenship: 148,592
Federal Territory Population: 1,588,750

...and this my fellow forumers concludes our adventure for tonight! There is a lot more to come! Next stop is a road trip through the United States. Then it's off to places like Spain, Sweden, Tanzania, Belgium, Denmark, Finland, Greece, Portugal, Chile, South Africa and more. So stay tuned!
Reply With Quote
     
     
  #102  
Old Posted Oct 11, 2018, 4:59 AM
Urbanguy's Avatar
Urbanguy Urbanguy is offline
Go Beavs! Go Niners!
 
Join Date: Dec 2001
Location: Portland | Honolulu
Posts: 6,195
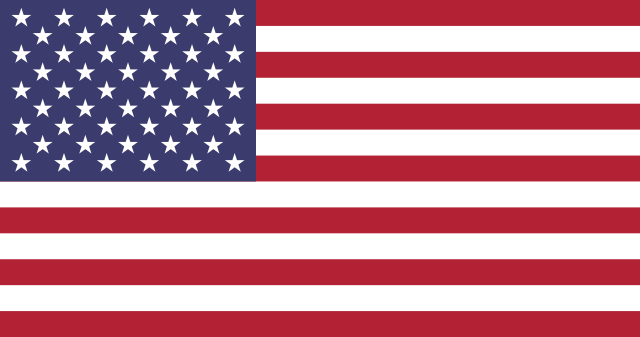
...and now we arrive in the United States of America...currently the third largest country by population in the World that also has the largest foreign-born population of any other country.

Before we get dive into the specifics -- here is a brief history of the country as brought to you by: usa.gov

"The history of the United States is vast and complex, but can be broken down into moments and time periods that divided, unified, and changed the United States into the country it is today:
1700-1799

The American Revolution (sometimes referred to as the American War of Independence or the Revolutionary War) was a conflict that lasted from 1775-1783 and allowed the original 13 colonies to remain independent from Great Britain.
American politician and soldier George Washington became the first president of the United States in 1789, serving two terms.
Beginning in Great Britain in the late 1790s, the Industrial Revolution eventually made its way to the United States and changed the focus of our economy and the way we manufacture products.

1800-1899

In 1803, President Thomas Jefferson agreed to the Louisiana Purchase, successfully adding 530 million acres of land to the United States. The area was purchased from France for $15 million. The following year, President Jefferson assigned Meriwether Lewis (who asked for help from William Clark) to head west and explore the newly purchased land. It took about a year and a half for the duo to reach the west coast.
The American Civil War divided the United States in two—the Northern States versus the Southern States. The outcome of the four year battle (1861-1865) kept the United States together as one whole nation and ended slavery.

1900-1999

On December 17, 1903, brothers Wilbur and Orville Wright became the first people to maintain a controlled flight in a powered, heavier-than-air machine. The Wright Flyer only flew for 12 seconds for a distance of 120 feet, but the technology would change the modern world forever.
On April 6, 1917, the United States entered World War I by declaring war on Germany.
After nearly 100 years of protests, demonstrations, and sit-ins, women of the United States were officially granted the right to vote after the 19th Amendment was ratified on August 26, 1920.
The worst economic crisis to happen in the United States occurred when the stock market crashed in October 1929, resulting in the Great Depression.
World War II officially begins in September 1939 after Germany invades Poland. The United States didn’t enter the war until after the Japanese attack on Pearl Harbor on December 7, 1941.
On August 6 and August 9, 1945, the United States dropped an atomic bomb on the Japanese cities of Hiroshima and Nagasaki, effectively ending World War II.
After World War II, an agreement was reached to divide Korea into two parts: a northern half to be controlled by the Soviet Union and a southern half to be controlled by the United States. The division was originally meant as a temporary solution, but the Soviet Union managed to block elections that were held to elect someone to unify to the country. Instead, the Soviet Union sent North Korean troops across the 38th parallel leading to the three-year-long (1950-1953) Korean War.
From 1954-1968, the African-American Civil Rights movement took place, especially in the Southern states. Fighting to put an end to racial segregation and discrimination, the movement resulted in the 1964 Civil Rights Act, the 1965 Voting Rights Act, and the 1968 Fair Housing Act.
The Vietnam War was a nearly 20-year battle (November 1, 1955–April 30, 1975) between North Vietnam and South Vietnam. North Vietnam won the war and Vietnam became a unified country.
The Apollo 11 mission (July 16-24, 1969) allowed United States astronauts Neil Armstrong and Edwin “Buzz” Aldrin to become the first humans to walk on the moon’s surface.

2000-Present

The terrorist attacks on September 11, 2001, changed the United States forever. Less than a month later (October 7, 2001) the United States began the War in Afghanistan, which is still happening today.
On March 20, 2003, the United States invaded and occupied Iraq. The war lasted for more than eight years before it was officially declared over on December 18, 2011.
In 2008, Barack Obama became the first African-American to be elected president of the United States."


We've got a lot of statistics to go through but I hope that you will enjoy this journey.


Image Source: wikimedia.org

Top 50 Non-United States countries or places of birth
*Puerto Rico included in Top 50 (but not considered foreign-born)

United States of America 2017

1 México (Estados Unidos Mexicanos) 11,269,913
2 India (Bhārat) 2,610,537
3 China, People's Republic of 2,216,810
4 Philippines (Pilipinas), Republic of the 2,008,080
5 Puerto Rico 1,795,234
6 El Salvador 1,401,832
7 Vietnam (Việt Nam), Socialist Republic of 1,342,568
8 Cuba 1,311,803
9 Dominican Republic (República Dominicana) 1,162,568
10 Korea, Republic of (South) 1,063,074

11 Guatemala 958,842
12 Canada 809,267
13 Colombia 783,032
14 Jamaica 744,658
15 United Kingdom 702,567
16 Haïti 679,752
17 Honduras 655,362
18 Germany (Deutschland) 552,640
19 Perú 458,785
20 Ecuador 454,178

21 Brasil 451,084
22 Poland (Polska) 418,775
23 Russian Federation (Russia) 403,670
24 Iran, Islamic Republic of 395,429
25 Pakistan 391,976
26 Taiwan 391,323
27 Ukraine 354,494
28 Venezuela, Bolivarian Republic of 351,144
29 Nigeria 344,979
30 Japan 344,453

31 Italy (Italia) 333,911
32 Guyana 268,577
33 Nicaragua 262,820
34 Thailand 256,136
35 Ethiopia 249,991
36 Bangladesh 248,696
37 China, Hong Kong (Special Administrative Region) 235,705
38 Trinidad and Tobago 234,534
39 Iraq 232,418
40 Portugal 205,194

41 Lao People's Democratic Republic (Laos) 186,035
42 France 185,775
43 Egypt, Arab Republic of 184,359
44 Argentine Republic (Argentina) 180,521
45 Romania (România) 165,199
46 Ghana 164,610
47 Myanmar (Burma) 160,275
48 Cambodia (Kampuchea) 153,199
49 Nepal 152,685
50 Israel (Yisra'el) 142,934

Total Foreign-born: 44,525,855
Total Population: 325,719,178
Source: ACS 1-year estimates, US Census 2017
U.S. Island Areas (Guam, USVI, American Samoa, CNMI) 212,597

*The USA has the largest population of permanent immigrants born in Mexico, El Salvador, Vietnam, South Korea, Dominican Republic, Philippines, Puerto Rico, Guatemala, Cuba, China, Jamaica, India, Trinidad & Tobago, Saint Vincent & the Grenadines, Barbados, Belize, Guyana, Federated States of Micronesia, Marshall Islands, Palau, Canada, Colombia, Haiti, Laos, Thailand, Ethiopia, Nigeria, Japan, Hong Kong, Taiwan, Nicaragua, Cambodia, Myanmar, Israel, Honduras, Peru among many others in either all of the world outside of their country/place of birth or outside of their region of origin than any other country in the World. It is that massive as crazy as it may seem.

**As for specific Territories & Commonwealths (besides Puerto Rico) that lived in US States in 2016** 2017 figures as specific as these haven't been released yet:

U.S. Island Areas (Guam, USVI, American Samoa, CNMI)
Guam (Guåhan) 98,199
Virgin Islands, United States 72,250
Samoa, American 31,339
Northern Mariana Islands 12,659
Other U.S. Island Areas 358

The next set are not estimates from the US Census 1-year American Community Survey Statistics but are from the Department of Homeland Security (DHS) annual legal permanent resident statistics (recently settled immigrants).

Top 100 (newly added) Permanent Residents by Country of Birth


United States of America 2017

1 Mexico 170,581 15.13%
2 China, People's Republic 71,565 6.35%
3 Cuba 65,028 5.77%
4 India 60,394 5.36%
5 Dominican Republic 58,520 5.19%
6 Philippines 49,147 4.36%
7 Vietnam 38,231 3.39%
8 El Salvador 25,109 2.23%
9 Jamaica 21,905 1.94%
10 Haiti 21,824 1.94%

11 Afghanistan 19,538 1.73%
12 Korea, South 19,194 1.70%
13 Colombia 17,956 1.59%
14 Pakistan 17,408 1.54%
15 Brazil 14,989 1.33%
16 Bangladesh 14,693 1.30%
17 Ethiopia 14,637 1.30%
18 Iraq 14,203 1.26%
19 Iran 13,791 1.22%
20 Nigeria 13,539 1.20%

21 Guatemala 13,198 1.17%
22 Burma 12,897 1.14%
23 Venezuela 11,809 1.05%
24 Nepal 11,610 1.03%
25 Canada 11,484 1.02%
26 Honduras 11,387 1.01%
27 United Kingdom 10,948 0.97%
28 Ecuador 10,594 0.94%
29 Ukraine 10,135 0.90%
30 Peru 10,115 0.90%

31 Egypt 9,834 0.87%
32 Russia 8,918 0.79%
33 Congo, Democratic Republic 8,709 0.77%
34 Ghana 8,455 0.75%
35 Somalia 7,404 0.66%
36 Kenya 6,957 0.62%
37 Thailand 6,311 0.56%
38 Yemen 6,029 0.53%
39 Syria 5,877 0.52%
40 Albania 5,722 0.51%

41 Guyana 5,468 0.49%
42 Jordan 5,264 0.47%
43 Taiwan 4,858 0.43%
44 Poland 4,845 0.43%
45 Turkey 4,844 0.43%
46 France 4,782 0.42%
47 Cameroon 4,668 0.41%
48 Germany 4,662 0.41%
49 Japan 4,635 0.41%
50 Morocco 4,229 0.38%

51 Liberia 4,155 0.37%
52 Malaysia 4,109 0.36%
53 Uzbekistan 4,095 0.36%
54 Cambodia 4,056 0.36%
55 Israel 3,802 0.34%
56 Italy 3,655 0.32%
57 Sudan 3,515 0.31%
58 Argentina 3,482 0.31%
59 Armenia 3,437 0.30%
60 Trinidad and Tobago 3,100 0.28%

61 Nicaragua 3,072 0.27%
62 Spain 3,045 0.27%
63 Romania 2,953 0.26%
64 Bhutan 2,940 0.26%
65 South Africa 2,912 0.26%
66 Australia 2,906 0.26%
67 Lebanon 2,818 0.25%
68 Cabo Verde 2,618 0.23%
69 Moldova 2,480 0.22%
70 Eritrea 2,449 0.22%

71 Hong Kong 2,415 0.21%
72 Bulgaria 2,184 0.19%
73 Costa Rica 2,184 0.19%
74 Algeria 2,139 0.19%
75 Saudi Arabia 2,135 0.19%
76 Sierra Leone 2,058 0.18%
77 Belarus 1,919 0.17%
78 Indonesia 1,914 0.17%
79 Uganda 1,898 0.17%
80 Cote d'Ivoire 1,810 0.16%

81 Georgia 1,629 0.14%
82 Sri Lanka 1,627 0.14%
83 Chile 1,625 0.14%
84 Togo 1,572 0.14%
85 Bolivia 1,510 0.13%
86 Ireland 1,485 0.13%
87 Senegal 1,470 0.13%
88 Tanzania 1,415 0.13%
89 Serbia 1,410 0.13%
90 Rwanda 1,394 0.12%

91 Kazakhstan 1,377 0.12%
92 Guinea 1,348 0.12%
93 Greece 1,314 0.12%
94 United Arab Emirates 1,314 0.12%
95 Kuwait 1,177 0.10%
96 Gambia 1,134 0.10%
97 Burundi 1,094 0.10%
98 Netherlands 1,056 0.09%
99 Macedonia 1,027 0.09%
100 Kosovo 1,014 0.09%

Total Permanent Residents by Country of Birth: 1,127,167
Source: USCIS 2017

Top 10 Source Countries of Refugee Resettlement

United States of America 2016

1 Congo, Democratic Republic of 16,370
2 Syria 12,587
3 Burma 12,347
4 Iraq 9,880
5 Somalia 9,020
6 Bhutan 5,817
7 Iran 3,750
8 Afghanistan 2,737
9 Ukraine 2,543
10 Eritrea 1,949

Total Refugee Admissions: 84,994

Special Immigrant Visa (SIV)* Arrivals (not included above) 2016
Afghanistan 10,220
Iraq 2,049

Top Ten Refugee Native Languages

United States of America 2016
1 Arabic 21,527
2 Somali 8,203
3 Kiswahili 6,532
4 Nepali *(Ethnic Nepalese mainly from Bhutan) 5,840
5 Sgaw Karen *(native to Burma/Myanmar) 2,740
6 Farsi (Western) 1,919
7 Armenian 1,575
8 Burmese *(native to Burma/Myanmar) 1,341
9 Spanish 1,338
10 Chaldean *(native to places like Iraq, Syria) 348

Excludes: Special Immigrant Visa (SIV)* Arrivals
Source: US Department of State (Bureau of Population, Refugees, and Migration)

Top 10 Source Countries of Refugee Resettlement

United States of America 2017

1 Congo, Democratic Republic of 9,377
2 Iraq 6,886
3 Syria 6,557
4 Somalia 6,130
5 Burma 5,078
6 Ukraine 4,264
7 Bhutan 3,550
8 Iran 2,577
9 Eritrea 1,917
10 Afghanistan 1,311

Total Refugee Admissions: 53,716

Special Immigrant Visa (SIV)* Arrivals (not included above) 2017
Afghanistan 16,866
Iraq 2,455

Top Ten Refugee Native Languages

United States of America 2017
1 Arabic 12,175
2 Somali 5,454
3 Nepali *(Ethnic Nepalese mainly from Bhutan) 3,580
4 Kiswahili 3,516
5 Spanish 1,675
6 Farsi (Western) 1,568
7 Sgaw Karen *(native to Burma/Myanmar) 1,190
8 Armenian 907
9 Burmese *(native to Burma/Myanmar) 457
10 Chaldean *(native to places like Iraq, Syria) 369

Excludes: Special Immigrant Visa (SIV)* Arrivals
Source: US Department of State (Bureau of Population, Refugees, and Migration)

Number of Refugees Settled in USA since 1975: 3,413,724

Top Ten Individuals Granted Asylum Affirmatively by Country of Nationality

United States of America 2016
1 El Salvador 1,404
2 China, People's Republic 1,381
3 Guatemala 1,317
4 Honduras 885
5 Egypt 690
6 Syria 660
7 Iraq 611
8 Mexico 455
9 Iran 381
10 Venezuela 328

All other countries, including unknown: 3,617
Total Granted Asylum: 11,729

...We're exploring metro areas next so hang in there!
Reply With Quote
     
     
  #103  
Old Posted Oct 11, 2018, 5:23 AM
Urbanguy's Avatar
Urbanguy Urbanguy is offline
Go Beavs! Go Niners!
 
Join Date: Dec 2001
Location: Portland | Honolulu
Posts: 6,195
...and for tonight we are going to explore the 6 largest metropolitan areas/regions in the US...

Kicking things off is the largest metropolitan area in the land and one of the largest in the World. It is truly a beast not just by population, skyline but also the sheer size of it's foreign born and the diverse regions of the world that they come from -- it's very difficult to compare with this giant as it is in a league of its own...and that is...


Image Source: ny.curbed.com

Top 50 Non-United States countries or places of birth
*Puerto Rico included in Top 50 (but not considered foreign-born)

New York City, United States 2017

1 Dominican Republic (República Dominicana) 709,482
2 China, People's Republic of 514,656
3 India (Bhārat) 417,996
4 Puerto Rico 400,627
5 México (Estados Unidos Mexicanos) 328,327
6 Jamaica 291,997
7 Ecuador 280,896
8 Colombia 210,947
9 Guyana 175,190
10 Haïti 174,119

11 El Salvador 163,819
12 Philippines (Pilipinas), Republic of the 154,745
13 Korea, Republic of (South) 150,962
14 Italy (Italia) 124,967
15 Perú 124,076
16 Bangladesh 122,520
17 Poland (Polska) 113,122
18 Guatemala 112,937
19 Trinidad and Tobago 111,174
20 Honduras 91,091

21 Russian Federation (Russia) 90,512
22 Ukraine 87,606
23 Pakistan 85,666
24 United Kingdom 84,573
25 Cuba 67,853
26 Brasil 64,921
27 Nigeria 58,137
28 Canada 53,673
29 Germany (Deutschland) 51,378
30 China, Hong Kong (Special Administrative Region) 50,818

31 Portugal 48,696
32 Egypt, Arab Republic of 48,435
33 Ghana 41,568
34 Taiwan 40,226
35 Greece (Hellenic Republic) 40,204
36 Japan 36,204
37 Ireland, Republic of (Éire) 35,314
38 Vietnam (Việt Nam), Socialist Republic of 33,791
39 Israel (Yisra'el) 33,621
40 France 32,235

41 Albania (Shqiperia) 32,161
42 Barbados 31,985
43 Argentine Republic (Argentina) 29,721
44 Uzbekistan (O‘zbekiston) 28,899
45 Turkey (Türkiye) 27,030
46 Venezuela, Bolivarian Republic of 24,037
47 Spain (España) 23,887
48 Romania (România) 23,365
49 Chile 22,357
50 Grenada (Camerhogne) 21,664

Total Foreign-born: 6,463,292
CSA Population: 23,876,155

U.S. Island Areas (Guam, USVI, American Samoa, CNMI) 14,675
*NYC has the largest population of people born in the Dominican Republic, Puerto Rico, Jamaica, Guyana, Trinidad & Tobago, Barbados, Grenada, Saint Vincent & the Grenadines, Dominica, Peru & Ecuador (to name a few) than any other metro outside of their region of origin (e.g., South America, Caribbean, etc.) NYC also has the largest population of immigrants born in India, China, Egypt, Nigeria, Ghana, Israel, Uzbekistan, Albania, Greece, Bangladesh, Ireland, Germany, Russia, Ukraine & Italy than any other metro in the Americas.

Top 40 newly added legal permanent residents by country of birth

New York-Newark-Jersey City, NY-NJ-PA/Bridgeport-Stamford-Norwalk, CT 2017

1 Dominican Republic 33,768
2 China, People's Republic 18,343
3 India 9,780
4 Jamaica 8,198
5 Bangladesh 7,906
6 Ecuador 6,232
7 Haiti 5,764
8 Colombia 4,339
9 Pakistan 4,233
10 Guyana 3,955

11 Philippines 3,799
12 Mexico 3,627
13 El Salvador 3,176
14 Korea, South 2,793
15 Egypt 2,760
16 Peru 2,668
17 Uzbekistan 2,331
18 Ghana 2,291
19 Brazil 2,140
20 Yemen 2,121

21 Ukraine 1,975
22 Nigeria 1,901
23 Honduras 1,781
24 Russia 1,708
25 United Kingdom 1,659
26 Albania 1,616
27 Trinidad and Tobago 1,603
28 Poland 1,371
29 Guatemala 1,335
30 Nepal 1,210

31 Cuba 1,127
32 Turkey 1,102
33 Canada 1,087
34 France 1,007
35 Georgia 952
36 Israel 905
37 Morocco 779
38 Italy 770
39 Venezuela 740
40 Vietnam 703

Total CBSA/MSA or Combined Tallied & Represented of CSA above: 178,821
Total CSA or MSA Legal Permanent Residents: 186,876 (meaning there's another 8,055 in the CSA that aren't included in the total that the Top 40 was compiled from). So each could be higher.
Total Legal Permanent Residents by Country of Birth
Source: U.S. Department of Homeland Security.

Next up we head to the West Coast to the other giant in the US that -- in so many ways a world a part culturally from NYC and that city is...


Image Source: fourseasons.com

Top 50 Non-United States countries or places of birth
*Puerto Rico included in Top 50 (but not considered foreign-born)

Los Angeles, United States 2017

1 México (Estados Unidos Mexicanos) 2,280,398
2 Philippines (Pilipinas), Republic of the 379,510
3 El Salvador 309,444
4 Vietnam (Việt Nam), Socialist Republic of 281,172
5 China, People's Republic of 266,616
6 Korea, Republic of (South) 241,257
7 Guatemala 205,816
8 Iran, Islamic Republic of 152,425
9 India (Bhārat) 121,797
10 Taiwan 104,294

11 Armenia (Hayastan) 71,559
12 Canada 62,807
13 Japan 56,174
14 United Kingdom 54,826
15 Honduras 45,766
16 Perú 43,539
17 China, Hong Kong (Special Administrative Region) 37,910
18 Cambodia (Kampuchea) 33,391
19 Germany (Deutschland) 31,943
20 Nicaragua 31,876

21 Thailand 31,252
22 Colombia 29,990
23 Indonesia 28,330
24 Cuba 27,450
25 Egypt, Arab Republic of 27,259
26 Russian Federation (Russia) 24,991
27 Lebanese Republic (Lebanon) 22,488
28 Argentine Republic (Argentina) 21,520
29 Pakistan 20,134
30 Syrian Arab Republic (Syria) 19,595

31 Ecuador 19,426
32 Israel (Yisra'el) 19,106
33 Puerto Rico 18,324
34 Ukraine 17,550
35 Brasil 16,888
36 France 16,645
37 Nigeria 14,832
38 Italy (Italia) 14,447
39 Belize 13,712
40 Australia 12,114

41 Iraq 11,124
42 Chile 10,827
43 South Africa, Republic of 10,789
44 Romania (România) 10,276
45 Bangladesh 10,257
46 Myanmar (Burma) 10,216
47 Poland (Polska) 9,822
48 Afghanistan, Islamic Republic of 9,403
49 Jamaica 8,861
50 Ethiopia 8,721

Total Foreign-born: 5,571,129
CSA Population: 18,788,800

U.S. Island Areas (Guam, USVI, American Samoa, CNMI) 12,574
*Los Angeles has the largest population of people born in Mexico, Belize, Philippines, South Korea, El Salvador, Guatemala & Taiwan than another metro outside of their region of origin (e.g., Asia, Central America, etc.). LA also has the largest population of people born in Armenia, Iran, Cambodia, Japan, Indonesia & Thailand than any other metro in the Americas.

Top 40 newly added legal permanent residents by country of birth

Los Angeles-Long Beach-Anaheim-Riverside-San Bernardino-Ontario, CA 2017

1 Mexico 26,823
2 China, People's Republic 11,146
3 Philippines 7,285
4 Vietnam 6,343
5 El Salvador 5,004
6 Iran 4,411
7 Korea, South 4,288
8 Guatemala 2,550
9 Armenia 2,506
10 India 2,499

11 Egypt 1,092
12 Taiwan 1,014
13 Afghanistan 916
14 Syria 895
15 United Kingdom 887
16 Honduras 874
17 Canada 839
18 Peru 791
19 Russia 737
20 Japan 726

21 Cambodia 711
22 Pakistan 662
23 Thailand 621
24 Bangladesh 614
25 Brazil 596
26 Colombia 576
27 Nigeria 535
28 Israel 446
29 Jordan 422
30 France 420

31 Indonesia 411
32 Ukraine 394
33 Iraq 386
34 Australia 381
35 Hong Kong 381
36 Lebanon 370
37 Germany 350
38 Cuba 328
39 Nicaragua 304
40 Nepal 300

Total CBSA/MSA or Combined Tallied & Represented of CSA above: 98,457
Total CSA or MSA Legal Permanent Residents: 101,275 *Similar explanation as NYC's
Total Legal Permanent Residents by Country of Birth
Source: U.S. Department of Homeland Security.


Image Source: ericbowersphoto.com

Top 50 Non-United States countries or places of birth
*Puerto Rico included in Top 50 (but not considered foreign-born)

Chicago, United States 2017

1 México (Estados Unidos Mexicanos) 639,520
2 India (Bhārat) 146,819
3 Poland (Polska) 134,324
4 Philippines (Pilipinas), Republic of the 82,178
5 China, People's Republic of 61,315
6 Puerto Rico 49,993
7 Korea, Republic of (South) 36,533
8 Pakistan 30,111
9 Ukraine 26,943
10 Guatemala 26,343

11 Vietnam (Việt Nam), Socialist Republic of 21,994
12 Italy (Italia) 18,660
13 Germany (Deutschland) 18,542
14 Ecuador 18,127
15 Nigeria 16,801
16 Romania (România) 16,604
17 Russian Federation (Russia) 16,554
18 Canada 15,778
19 United Kingdom 15,135
20 Honduras 13,683

21 Greece (Hellenic Republic) 13,401
22 Bulgaria (Balgariya) 13,101
23 Iraq 12,962
24 Colombia 12,916
25 Lithuania (Lietuva) 12,076
26 El Salvador 11,805
27 Bosnia and Herzegovina 9,481
28 Jordan (Al Urdun) 9,107
29 Japan 8,716
30 Syrian Arab Republic (Syria) 8,223

31 Jamaica 7,591
32 Cuba 7,509
33 Perú 7,495
34 Ireland, Republic of (Éire) 6,760
35 Egypt, Arab Republic of 6,514
36 Taiwan 6,472
37 Ghana 6,430
38 Serbia (Srbija) 5,858
39 China, Hong Kong (Special Administrative Region) 5,682
40 Belarus 5,486

41 Brasil 5,480
42 Saudi Arabia 5,432
43 Iran, Islamic Republic of 5,420
44 Thailand 5,294
45 Czechoslovakia, former 5,290
46 Belize 4,672
47 Israel (Yisra'el) 4,663
48 Croatia (Hrvatska) 4,277
49 Argentine Republic (Argentina) 4,270
50 Moldova, Republic of 4,139

Total Foreign-born: 1,734,662
CSA Population: 9,901,356

U.S. Island Areas (Guam, USVI, American Samoa, CNMI) 1,223
*Chicago has the largest Poland-born population of any metro area in all of the Americas.

Top 40 newly added legal permanent residents by country of birth

Chicago-Naperville-Elgin, IL-IN-WI 2017

1 Mexico 9,596
2 India 3,713
3 China, People's Republic 1,793
4 Philippines 1,667
5 Poland 1,504
6 Pakistan 1,123
7 Ukraine 1,090
8 Nigeria 679
9 Vietnam 646
10 Jordan 624

11 Korea, South 582
12 Iraq 518
13 Burma 439
14 Moldova 439
15 Bulgaria 417
16 Guatemala 355
17 Albania 352
18 Syria 350
19 Russia 348
20 Romania 335

21 Ecuador 326
22 United Kingdom 318
23 Colombia 299
24 Serbia 291
25 Canada 285
26 Iran 279
27 Ghana 274
28 Malaysia 255
29 Ethiopia 240
30 Nepal 229

31 Yemen 229
32 Brazil 210
33 Lithuania 207
34 Egypt 201
35 Jamaica 200
36 Congo, Democratic Republic 197
37 El Salvador 196
38 Honduras 184
39 Afghanistan 174
40 Dominican Republic 170

Total CBSA/MSA or Combined Tallied & Represented of CSA above: 36,832
Total CSA or MSA Legal Permanent Residents: 37,092
Total Legal Permanent Residents by Country of Birth
Source: U.S. Department of Homeland Security.

...we've got three more to go for tonight...but those are the big three overall population-wise.

Last edited by Urbanguy; Oct 11, 2018 at 5:59 AM.
Reply With Quote
     
     
  #104  
Old Posted Oct 11, 2018, 5:42 AM
Urbanguy's Avatar
Urbanguy Urbanguy is offline
Go Beavs! Go Niners!
 
Join Date: Dec 2001
Location: Portland | Honolulu
Posts: 6,195
...and now we travel back to the East Coast to the Capital of the USA...


Image Source: wikimedia.org

Top 50 Non-United States countries or places of birth
*Puerto Rico included in Top 50 (but not considered foreign-born)

Washington DC-Baltimore, United States 2017

1 El Salvador 221,308
2 India (Bhārat) 133,268
3 Korea, Republic of (South) 83,157
4 China, People's Republic of 78,175
5 Guatemala 70,708
6 México (Estados Unidos Mexicanos) 67,566
7 Philippines (Pilipinas), Republic of the 64,776
8 Ethiopia 58,360
9 Vietnam (Việt Nam), Socialist Republic of 52,957
10 Pakistan 47,522

11 Honduras 45,356
12 Perú 43,118
13 Nigeria 40,704
14 Jamaica 37,365
15 Puerto Rico 34,113
16 Ghana 29,875
17 Iran, Islamic Republic of 27,137
18 Bolivia, Plurinational State of 26,123
19 United Kingdom 25,738
20 Germany (Deutschland) 21,127

21 Cameroon 20,885
22 Colombia 20,434
23 Nepal 19,201
24 Dominican Republic (República Dominicana) 19,187
25 Afghanistan, Islamic Republic of 18,570
26 Russian Federation (Russia) 18,220
27 Canada 17,305
28 Trinidad and Tobago 16,445
29 Sierra Leone 15,778
30 Bangladesh 15,751

31 Taiwan 15,670
32 Brasil 12,858
33 Nicaragua 12,094
34 Egypt, Arab Republic of 11,944
35 Liberia 10,978
36 Japan 10,623
37 Ecuador 10,528
38 France 9,899
39 Ukraine 9,807
40 Guyana 9,517

41 Thailand 9,170
42 Morocco (Al Maghrib) 8,903
43 Argentine Republic (Argentina) 8,648
44 Haïti 8,036
45 Poland (Polska) 7,704
46 Kenya 7,587
47 Turkey (Türkiye) 7,503
48 Cuba 7,316
49 Saudi Arabia 7,160
50 Eritrea (Ertra) 6,668

Total Foreign-born: 1,778,172
CSA Population: 9,765,772

U.S. Island Areas (Guam, USVI, American Samoa, CNMI) 7,375
*Washington DC has the largest population of people born in Ethiopia, Sierra Leone & Cameroon of any metro in the Americas. It also has the largest population of immigrants born in Bolivia than any other metro outside of South America.

*Washington DC's metro could be argued as having the 2nd most diverse in the regional sources of immigrants that it attracts in the US behind NYC albeit at a much smaller scale but if you look closely it's not as top heavy as some of the others. You can see Africa, Latin America, Asia, the Middle East, etc. represented quite well.

Top 40 newly added legal permanent residents by country of birth

Washington-Arlington-Alexandria-Baltimore-Columbia-Towson, DC-VA-MD-WV 2017

1 El Salvador 3,999
2 Afghanistan 3,057
3 Ethiopia 2,997
4 India 2,600
5 China, People's Republic 2,311
6 Pakistan 1,704
7 Philippines 1,612
8 Nigeria 1,569
9 Cameroon 1,517
10 Vietnam 1,400

11 Nepal 1,343
12 Ghana 1,322
13 Korea, South 1,049
14 Iran 895
15 Mexico 866
16 Jamaica 855
17 Bangladesh 852
18 Peru 821
19 Guatemala 737
20 Sierra Leone 729

21 Honduras 708
22 Dominican Republic 592
23 Bolivia 582
24 Iraq 524
25 Colombia 522
26 Egypt 511
27 Burma 430
28 Sudan 425
29 Morocco 423
30 United Kingdom 394

31 Brazil 388
32 Russia 362
33 Liberia 361
34 Eritrea 307
35 Kenya 300
36 Turkey 300
37 Ukraine 270
38 Canada 268
39 Congo, Democratic Republic 260
40 Haiti 257

Total CBSA/MSA or Combined Tallied & Represented of CSA above: 48,317
Total CSA or MSA Legal Permanent Residents: 49,067
Total Legal Permanent Residents by Country of Birth
Source: U.S. Department of Homeland Security.

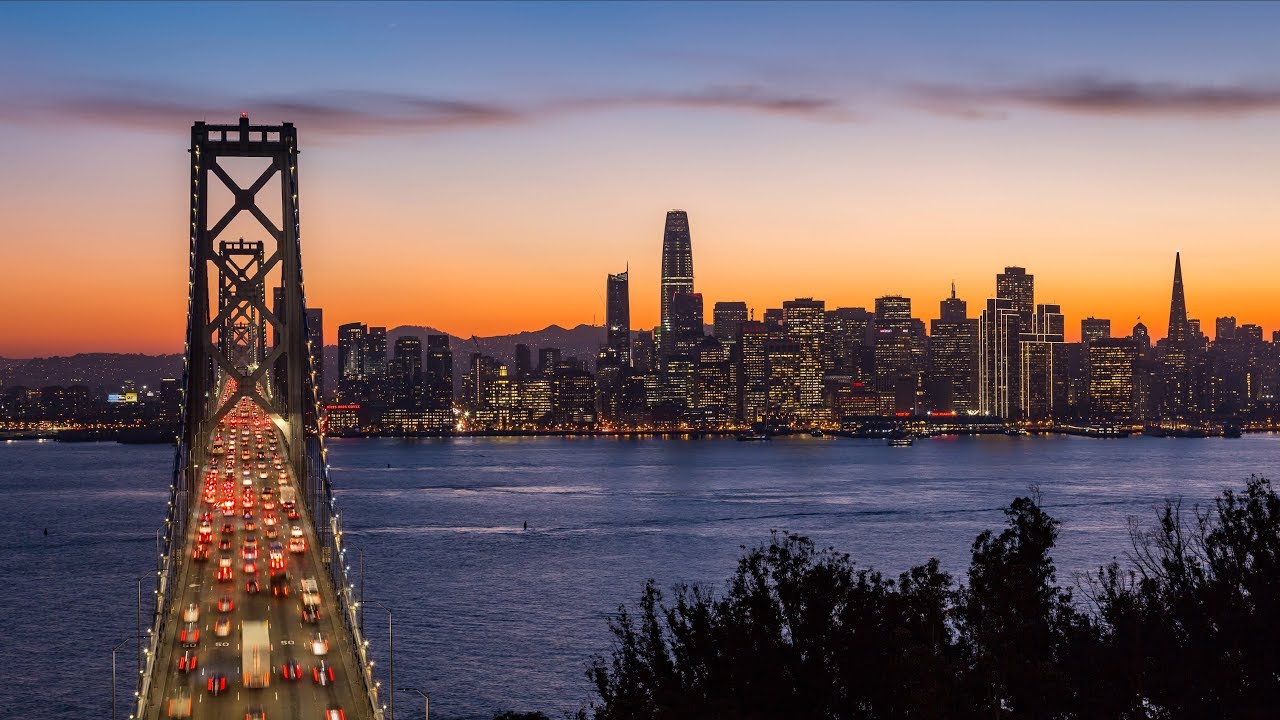
...and now we travel back to the West Coast and the home of my favorite NFL Football Team


Image Source: Emeric's [email protected]

Top 50 Non-United States countries or places of birth
*Puerto Rico included in Top 50 (but not considered foreign-born)

San Jose-San Francisco-Oakland, United States 2017

1 México (Estados Unidos Mexicanos) 568,174
2 China, People's Republic of 336,170
3 Philippines (Pilipinas), Republic of the 290,152
4 India (Bhārat) 285,934
5 Vietnam (Việt Nam), Socialist Republic of 170,439
6 El Salvador 85,219
7 Taiwan 63,870
8 China, Hong Kong (Special Administrative Region) 60,306
9 Korea, Republic of (South) 53,859
10 United Kingdom 45,536

11 Guatemala 43,015
12 Canada 37,036
13 Iran, Islamic Republic of 36,476
14 Nicaragua 30,295
15 Japan 29,560
16 Russian Federation (Russia) 27,241
17 Germany (Deutschland) 26,595
18 Pakistan 22,008
19 Brasil 20,205
20 Fiji Islands 19,370

21 Perú 19,217
22 France 18,931
23 Ukraine 15,226
24 Afghanistan, Islamic Republic of 15,119
25 Thailand 12,965
26 Cambodia (Kampuchea) 12,381
27 Israel (Yisra'el) 12,234
28 Nepal 11,815
29 Portugal 11,814
30 Myanmar (Burma) 11,741

31 Honduras 10,664
32 Italy (Italia) 9,757
33 Ethiopia 9,712
34 Puerto Rico 9,038
35 Australia 9,036
36 Indonesia 8,821
37 Lao People's Democratic Republic (Laos) 8,068
38 Argentine Republic (Argentina) 7,391
39 Spain (España) 7,361
40 Colombia 7,243

41 Ireland, Republic of (Éire) 7,211
42 Poland (Polska) 6,963
43 Singapore 6,849
44 Romania (România) 6,351
45 Malaysia 5,912
46 South Africa, Republic of 5,885
47 Netherlands (Nederland) 5,504
48 Turkey (Türkiye) 4,827
49 Egypt, Arab Republic of 4,718
50 Cuba 4,552

Total Foreign-born: 2,689,641
CSA Population: 8,837,789

U.S. Island Areas (Guam, USVI, American Samoa, CNMI) 9,484
*San Francisco may now have the largest population of immigrants born in Fiji than any other in the Americas. It also has the largest population born in Singapore of any metro in all of the Americas. It also has one of the largest (if not the largest) population of immigrants born in Myanmar (Burma) in the America's (can't say with 100% certainty because it might be Indianapolis but that metro lacked this data but attracts more annually).

Top 40 newly added legal permanent residents by country of birth

San Francisco-Oakland-Hayward-San Jose-Sunnyvale-Santa Clara-Stockton-Lodi, CA 2017

1 China, People's Republic 9,792
2 Mexico 7,867
3 India 5,856
4 Philippines 4,554
5 Vietnam 4,241
6 El Salvador 1,556
7 Afghanistan 1,495
8 Korea, South 1,382
9 Iran 1,252
10 Guatemala 1,205

11 Taiwan 1,106
12 Pakistan 921
13 Canada 872
14 United Kingdom 848
15 Russia 778
16 Brazil 626
17 France 592
18 Nepal 586
19 Hong Kong 563
20 Ethiopia 490

21 Ukraine 464
22 Peru 461
23 Israel 452
24 Japan 448
25 Yemen 440
26 Burma 398
27 Germany 379
28 Honduras 352
29 Turkey 335
30 Nigeria 262

31 Thailand 256
32 Italy 253
33 Australia 234
34 Colombia 230
35 Cambodia 224
36 Jordan 218
37 Fiji 215
38 Eritrea 213
39 Egypt 210
40 Nicaragua 207

Total CBSA/MSA or Combined Tallied & Represented of CSA above: 58,776
Total CSA or MSA Legal Permanent Residents: 63,101
Total Legal Permanent Residents by Country of Birth
Source: U.S. Department of Homeland Security.

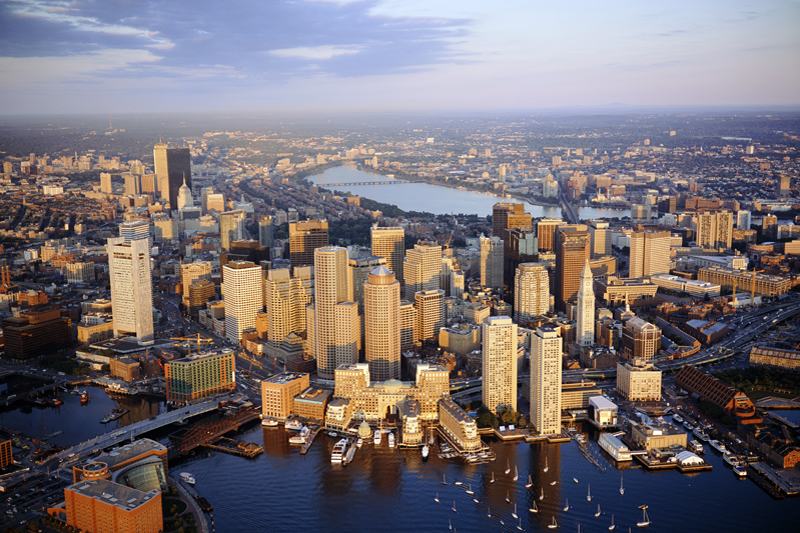
...and last but not least for tonight cause there's a lot to feast on --we head to New England to...


Image Source: newyorkbtg.com

Top 50 Non-United States countries or places of birth
*Puerto Rico included in Top 50 (but not considered foreign-born)

Boston, United States 2017

1 Dominican Republic (República Dominicana) 116,579
2 Puerto Rico 107,690
3 China, People's Republic of 100,957
4 India (Bhārat) 91,300
5 Portugal 84,941
6 Brasil 80,505
7 Haïti 58,517
8 Guatemala 41,518
9 Cabo Verde 40,148
10 El Salvador 40,148

11 Vietnam (Việt Nam), Socialist Republic of 36,340
12 Canada 33,186
13 Colombia 30,693
14 United Kingdom 30,184
15 Korea, Republic of (South) 22,426
16 Italy (Italia) 19,021
17 Cambodia (Kampuchea) 17,774
18 Russian Federation (Russia) 16,675
19 Germany (Deutschland) 16,432
20 Jamaica 16,146

21 México (Estados Unidos Mexicanos) 15,800
22 Ireland, Republic of (Éire) 14,977
23 Philippines (Pilipinas), Republic of the 13,779
24 Nigeria 13,518
25 Greece (Hellenic Republic) 11,471
26 Honduras 11,125
27 Ghana 11,079
28 Taiwan 10,991
29 Poland (Polska) 10,431
30 Albania (Shqiperia) 9,863

31 Ecuador 9,309
32 Japan 9,099
33 Nepal 9,092
34 Ukraine 8,880
35 China, Hong Kong (Special Administrative Region) 8,816
36 France 8,654
37 Lebanese Republic (Lebanon) 8,009
38 Morocco (Al Maghrib) 7,696
39 Kenya 6,781
40 Perú 6,467

41 Venezuela, Bolivarian Republic of 6,242
42 Iraq 6,168
43 Trinidad and Tobago 6,067
44 Lao People's Democratic Republic (Laos) 5,755
45 Turkey (Türkiye) 5,619
46 Thailand 5,608
47 Spain (España) 5,607
48 Israel (Yisra'el) 5,588
49 Cuba 5,303
50 Iran, Islamic Republic of 5,167

Total Foreign-born: 1,311,572
CSA Population: 8,233,270

U.S. Island Areas (Guam, USVI, American Samoa, CNMI) 2,412
*Boston has the largest population of immigrants born in Cabo Verde outside of Africa (yes even more than Lisbon). It's metro also has the largest population of people born in Brasil & Portugal (over 20,000 of which were born in the Azores) in North America.

Top 40 newly added legal permanent residents by country of birth

Boston-Cambridge-Newton-Providence-Warwick-Worcester, MA-CT-RI-NH 2017

1 Dominican Republic 6,968
2 China, People's Republic 2,535
3 Cabo Verde 2,462
4 Haiti 2,200
5 Brazil 2,194
6 India 1,887
7 Vietnam 1,226
8 Guatemala 949
9 El Salvador 946
10 Colombia 782

11 Albania 698
12 Nigeria 574
13 Morocco 523
14 Jamaica 509
15 Cambodia 503
16 Ghana 501
17 Nepal 482
18 United Kingdom 466
19 Canada 436
20 Kenya 402

21 Mexico 389
22 Korea, South 382
23 Russia 366
24 Ethiopia 357
25 Egypt 354
26 Pakistan 351
27 Iran 349
28 Philippines 349
29 Iraq 337
30 Liberia 312

31 Uganda 304
32 Honduras 301
33 France 262
34 Turkey 241
35 Congo, Democratic Republic 227
36 Bangladesh 216
37 Portugal 207
38 Lebanon 200
39 Cameroon 198
40 Ukraine 195

Total CBSA/MSA or Combined Tallied & Represented of CSA above: 38,914
Total CSA or MSA Legal Permanent Residents: 41,132
Total Legal Permanent Residents by Country of Birth
Source: U.S. Department of Homeland Security.

...Hope you all are enjoying our journey so far...the next time around we will be exploring the Big D as in Dallas, Philly, H-Town...Houston, Miami, ATL, Detroit and others...as usual...stay tuned!

Last edited by Urbanguy; Oct 12, 2018 at 4:11 AM.
Reply With Quote
     
     
  #105  
Old Posted Oct 11, 2018, 6:36 AM
Commentariat Commentariat is offline
Registered User
 
Join Date: Dec 2015
Posts: 106
Quote:
Originally Posted by Urbanguy View Post

Top 50 Non-United States countries or places of birth
*Puerto Rico included in Top 50 (but not considered foreign-born)

New York City, United States 2017

1 Dominican Republic (República Dominicana) 709,482
2 China, People's Republic of 514,656
3 India (Bhārat) 417,996
4 Puerto Rico 400,627
5 México (Estados Unidos Mexicanos) 328,327
6 Jamaica 291,997
7 Ecuador 280,896
8 Colombia 210,947
9 Guyana 175,190
10 Haïti 174,119

11 El Salvador 163,819
That’s a pretty random list at the top for the world’s number one immigration magnet. Dominican Republic, Puerto Rico, Jamaica, Ecuador, Guyana, Haiti and El Salvador have a combined population of about 50 million people, or 1 in 150 of the world’s population, but provide 1 in 3 of NYC’s immigrants. I guess it just goes to show the power of chain migration, which is evident in many of the cities and countries in this thread.
Reply With Quote
     
     
  #106  
Old Posted Oct 12, 2018, 1:16 AM
Urbanguy's Avatar
Urbanguy Urbanguy is offline
Go Beavs! Go Niners!
 
Join Date: Dec 2001
Location: Portland | Honolulu
Posts: 6,195
...and now we continue with our journey to the Big D, Dallas!


Image Source: andystravelblog.boardingarea.com

Top 50 Non-United States countries or places of birth
*Puerto Rico included in Top 50 (but not considered foreign-born)

Dallas-Fort Worth, United States 2017

1 México (Estados Unidos Mexicanos) 636,986
2 India (Bhārat) 125,591
3 El Salvador 63,995
4 Vietnam (Việt Nam), Socialist Republic of 62,310
5 China, People's Republic of 31,621
6 Honduras 27,125
7 Nigeria 25,787
8 Puerto Rico 24,663
9 Philippines (Pilipinas), Republic of the 24,340
10 Korea, Republic of (South) 22,021

11 Pakistan 19,058
12 Guatemala 17,954
13 Ethiopia 16,376
14 Kenya 14,086
15 Canada 13,270
16 Iraq 12,809
17 Nepal 12,499
18 United Kingdom 12,177
19 Taiwan 11,522
20 Iran, Islamic Republic of 11,161

21 Cuba 10,924
22 Colombia 10,427
23 Myanmar (Burma) 9,088
24 Germany (Deutschland) 8,638
25 Perú 8,250
26 Thailand 8,096
27 Brasil 7,503
28 Egypt, Arab Republic of 6,558
29 Bangladesh 6,272
30 Ghana 5,766

31 Japan 5,373
32 Venezuela, Bolivarian Republic of 5,015
33 Russian Federation (Russia) 4,383
34 Nicaragua 4,198
35 Jordan (Al Urdun) 4,171
36 Romania (România) 3,845
37 Lebanese Republic (Lebanon) 3,748
38 Lao People's Democratic Republic (Laos) 3,611
39 Australia 3,396
40 Malaysia 3,387

41 Cameroon 3,318
42 Eritrea (Ertra) 3,217
43 Argentine Republic (Argentina) 3,067
44 Trinidad and Tobago 3,048
45 Cambodia (Kampuchea) 2,857
46 South Africa, Republic of 2,856
47 China, Hong Kong (Special Administrative Region) 2,853
48 Somalia 2,836
49 Syrian Arab Republic (Syria) 2,794
50 Dominican Republic (República Dominicana) 2,635

Total Foreign-born: 1,412,213
CSA Population: 7,847,110

U.S. Island Areas (Guam, USVI, American Samoa, CNMI) 3,678

*Currently, Dallas has the largest population of immigrants born in Kenya in all of the Americas.

Top 40 newly added legal permanent residents by country of birth

Dallas-Fort Worth-Arlington, TX 2017

1 Mexico 9,468
2 India 2,956
3 Vietnam 1,674
4 China, People's Republic 1,122
5 El Salvador 1,086
6 Nepal 968
7 Afghanistan 925
8 Nigeria 904
9 Burma 828
10 Cuba 812

11 Iraq 762
12 Korea, South 758
13 Pakistan 709
14 Congo, Democratic Republic 683
15 Ethiopia 641
16 Kenya 581
17 Philippines 559
18 Iran 548
19 Honduras 371
20 Brazil 342

21 Bangladesh 334
22 Canada 292
23 Jordan 273
24 Egypt 272
25 Colombia 271
26 Cameroon 264
27 United Kingdom 249
28 Malaysia 233
29 Ghana 230
30 Venezuela 227

31 Guatemala 205
32 Peru 171
33 Sudan 167
34 Syria 145
35 Thailand 135
36 Jamaica 132
37 Dominican Republic 121
38 Russia 118
39 Cote d'Ivoire 112
40 Taiwan 110

Total CBSA/MSA or Combined Tallied & Represented of CSA above: 34,620
Total CSA or MSA Legal Permanent Residents: 35,199
Total Legal Permanent Residents by Country of Birth
Source: U.S. Department of Homeland Security.

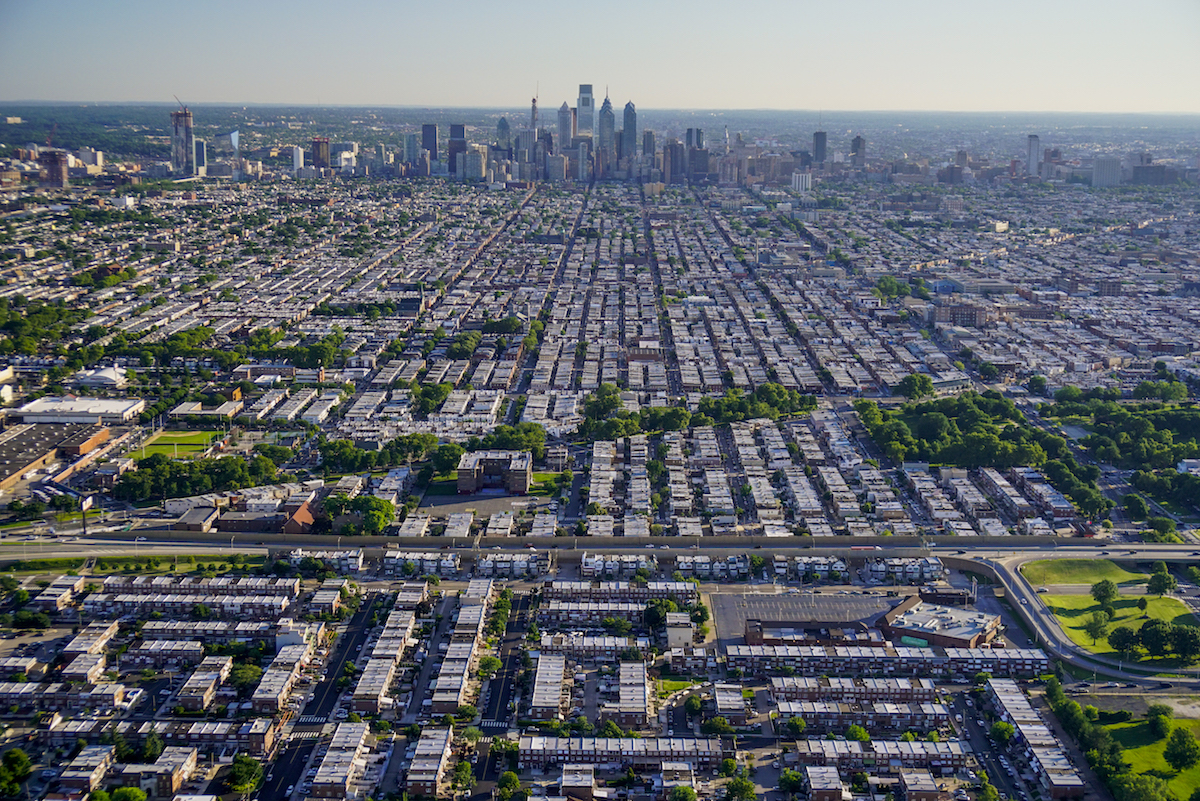
Next up we travel back east to the City of Brotherly Love. Philadelphia, which is Greek for "brotherly love," derived from the Ancient Greek terms φίλος phílos (beloved, dear) and ἀδελφός adelphós (brother, brotherly).


Image Source: generocity.org

Top 50 Non-United States countries or places of birth
*Puerto Rico included in Top 50 (but not considered foreign-born)

Philadelphia, United States 2017

1 Puerto Rico 109,667
2 India (Bhārat) 94,674
3 México (Estados Unidos Mexicanos) 73,604
4 Dominican Republic (República Dominicana) 49,713
5 China, People's Republic of 48,852
6 Vietnam (Việt Nam), Socialist Republic of 27,277
7 Korea, Republic of (South) 24,457
8 Jamaica 24,330
9 Philippines (Pilipinas), Republic of the 23,442
10 Haïti 18,646

11 United Kingdom 16,825
12 Ukraine 15,567
13 Liberia 15,002
14 Colombia 14,537
15 Italy (Italia) 14,460
16 Bangladesh 11,973
17 Guatemala 11,650
18 Canada 11,499
19 Brasil 9,719
20 Nigeria 9,058

21 Russian Federation (Russia) 9,042
22 Germany (Deutschland) 9,025
23 Ecuador 8,867
24 Honduras 7,921
25 El Salvador 7,625
26 Poland (Polska) 7,337
27 Pakistan 7,013
28 Albania (Shqiperia) 6,829
29 Taiwan 6,743
30 Trinidad and Tobago 6,708

31 Egypt, Arab Republic of 6,392
32 Ghana 6,020
33 Greece (Hellenic Republic) 5,934
34 Cambodia (Kampuchea) 5,815
35 Ireland, Republic of (Éire) 5,669
36 Turkey (Türkiye) 4,756
37 Perú 4,685
38 Kenya 4,583
39 Guyana 4,481
40 Nepal 4,214

41 France 4,180
42 Cuba 3,914
43 Uzbekistan (O‘zbekiston) 3,904
44 Venezuela, Bolivarian Republic of 3,550
45 Argentine Republic (Argentina) 3,358
46 Israel (Yisra'el) 3,357
47 Indonesia 3,338
48 Japan 3,308
49 Romania (România) 3,282
50 Belarus 3,266

Total Foreign-born: 787,263
CSA Population: 7,206,807

U.S. Island Areas (Guam, USVI, American Samoa, CNMI) 2,486

*Philadelphia has the largest population of immigrants that were born in Liberia outside of Africa.

Top 40 newly added legal permanent residents by country of birth

Philadelphia-Camden-Wilmington, PA-NJ-DE-MD 2017

1 India 2,068
2 Dominican Republic 1,817
3 China, People's Republic 1,696
4 Vietnam 884
5 Liberia 877
6 Mexico 850
7 Jamaica 686
8 Bangladesh 505
9 Haiti 483
10 Pakistan 465

11 Albania 432
12 Philippines 426
13 Ukraine 389
14 Nigeria 338
15 Korea, South 324
16 Egypt 306
17 Uzbekistan 274
18 Sierra Leone 247
19 Russia 223
20 Ghana 220

21 Colombia 217
22 Algeria 215
23 Brazil 201
24 United Kingdom 201
25 Cambodia 175
26 Afghanistan 172
27 Morocco 161
28 Turkey 161
29 Canada 151
30 Ecuador 145

31 Ethiopia 144
32 Belarus 130
33 Georgia 130
34 Iraq 130
35 Guatemala 126
36 Kenya 126
37 Iran 117
38 Nepal 110
39 Sudan 107
40 Poland 105

Total CBSA/MSA or Combined Tallied & Represented of CSA above: 19,948
Total CSA or MSA Legal Permanent Residents: 23,143
Total Legal Permanent Residents by Country of Birth
Source: U.S. Department of Homeland Security.

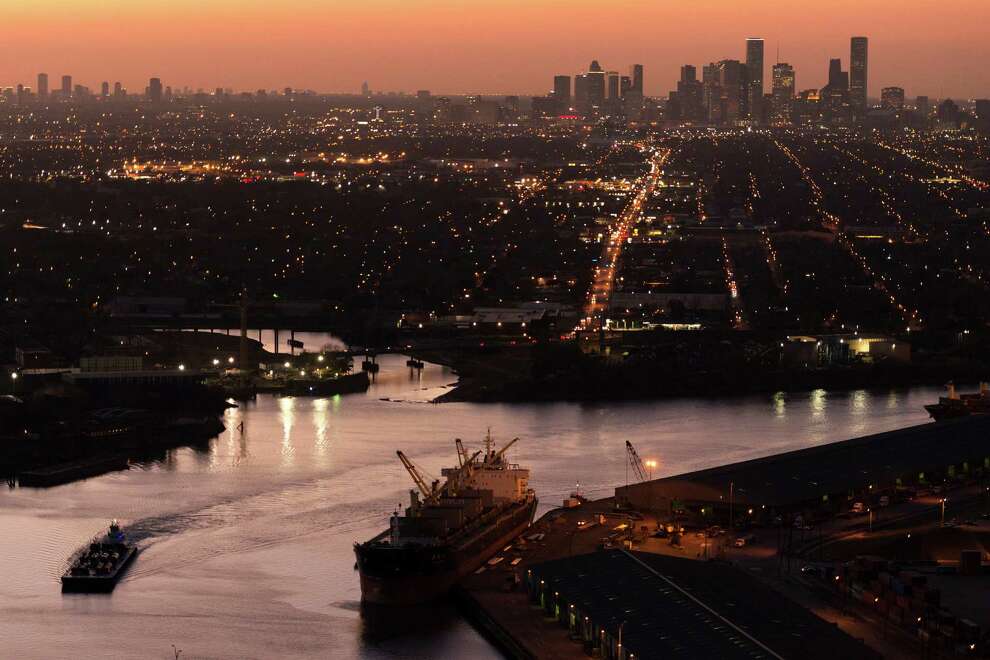
Back to Texas we go to the 2nd largest metro area in that State...


Image Source: HoustonChronicle.com

Top 50 Non-United States countries or places of birth
*Puerto Rico included in Top 50 (but not considered foreign-born)

Houston, United States 2017

1 México (Estados Unidos Mexicanos) 624,727
2 El Salvador 129,823
3 India (Bhārat) 93,002
4 Vietnam (Việt Nam), Socialist Republic of 91,865
5 Honduras 70,448
6 China, People's Republic of 47,507
7 Guatemala 46,698
8 Nigeria 41,125
9 Philippines (Pilipinas), Republic of the 37,656
10 Cuba 35,522

11 Pakistan 34,082
12 Venezuela, Bolivarian Republic of 32,500
13 Colombia 26,608
14 United Kingdom 24,261
15 Canada 18,254
16 Puerto Rico 17,019
17 Korea, Republic of (South) 14,054
18 Taiwan 12,271
19 Iran, Islamic Republic of 11,472
20 Perú 10,871

21 Germany (Deutschland) 7,714
22 Nicaragua 7,637
23 Brasil 7,284
24 Kenya 6,914
25 Russian Federation (Russia) 6,716
26 Dominican Republic (República Dominicana) 6,614
27 Lebanese Republic (Lebanon) 6,400
28 Japan 6,092
29 Trinidad and Tobago 5,749
30 Iraq 5,669

31 Jamaica 5,563
32 South Africa, Republic of 5,500
33 Bangladesh 5,303
34 Ethiopia 5,204
35 France 4,939
36 Cambodia (Kampuchea) 4,486
37 Egypt, Arab Republic of 4,085
38 Argentine Republic (Argentina) 3,988
39 Panamá 3,935
40 Saudi Arabia 3,874

41 Spain (España) 3,704
42 Cameroon 3,647
43 Syrian Arab Republic (Syria) 3,353
44 China, Hong Kong (Special Administrative Region) 3,163
45 Turkey (Türkiye) 2,907
46 Italy (Italia) 2,868
47 Indonesia 2,791
48 Haïti 2,755
49 Australia 2,699
50 Jordan (Al Urdun) 2,675

Total Foreign-born: 1,646,006
CSA Population: 7,092,493

U.S. Island Areas (Guam, USVI, American Samoa, CNMI) 7,142

Top 40 newly added legal permanent residents by country of birth

Houston-The Woodlands-Sugar Land, TX 2017

1 Mexico 8,633
2 Cuba 3,516
3 Vietnam 2,805
4 India 2,328
5 El Salvador 1,856
6 China, People's Republic 1,673
7 Nigeria 1,319
8 Pakistan 1,189
9 Venezuela 993
10 Philippines 961

11 Iraq 829
12 Honduras 745
13 Afghanistan 700
14 Colombia 687
15 Iran 581
16 United Kingdom 544
17 Brazil 380
18 Canada 336
19 Guatemala 293
20 Korea, South 287

21 Nepal 281
22 Ethiopia 267
23 Turkey 238
24 Cameroon 233
25 Burma 222
26 Egypt 221
27 Jordan 190
28 Syria 185
29 Russia 182
30 Dominican Republic 181

31 Bangladesh 169
32 Argentina 165
33 Taiwan 164
34 Congo, Democratic Republic 161
35 Cambodia 152
36 Lebanon 146
37 Jamaica 142
38 Peru 137
39 France 133
40 Kenya 133

Total CBSA/MSA or Combined Tallied & Represented of CSA above: 38,686
Total CSA or MSA Legal Permanent Residents: 39,093
Total Legal Permanent Residents by Country of Birth
Source: U.S. Department of Homeland Security.

...more to come...
Reply With Quote
     
     
  #107  
Old Posted Oct 12, 2018, 3:03 AM
Urbanguy's Avatar
Urbanguy Urbanguy is offline
Go Beavs! Go Niners!
 
Join Date: Dec 2001
Location: Portland | Honolulu
Posts: 6,195
...and now we head deep into the southeastern coast of Florida to a city that is an exotic cultural mix of (US) American, Latin American and Caribbean... and that city is...


Image Source: picturesmania.com

Top 50 Non-United States countries or places of birth
*Puerto Rico included in Top 50 (but not considered foreign-born)

Miami, United States 2017

1 Cuba 816,616
2 Haïti 252,052
3 Colombia 183,429
4 Jamaica 141,971
5 Venezuela, Bolivarian Republic of 125,228
6 Puerto Rico 103,370
7 Nicaragua 89,860
8 México (Estados Unidos Mexicanos) 82,192
9 Dominican Republic (República Dominicana) 81,590
10 Honduras 75,996

11 Perú 68,260
12 Brasil 62,116
13 Guatemala 51,182
14 Argentine Republic (Argentina) 43,289
15 Canada 39,360
16 El Salvador 35,582
17 Ecuador 35,289
18 Trinidad and Tobago 22,909
19 India (Bhārat) 21,507
20 Philippines (Pilipinas), Republic of the 21,373

21 United Kingdom 20,630
22 China, People's Republic of 20,311
23 Chile 15,186
24 Italy (Italia) 14,200
25 Germany (Deutschland) 13,908
26 Spain (España) 13,506
27 Bahamas, The 12,637
28 Israel (Yisra'el) 11,637
29 Russian Federation (Russia) 11,180
30 Guyana 10,402

31 Uruguay, Eastern Republic of 10,311
32 France 9,524
33 Ukraine 8,793
34 Vietnam (Việt Nam), Socialist Republic of 8,668
35 Panamá 8,419
36 Poland (Polska) 7,725
37 South Africa, Republic of 7,558
38 Costa Rica 7,053
39 Bolivia, Plurinational State of 6,710
40 Romania (România) 5,494

41 Thailand 5,104
42 Pakistan 4,936
43 Bangladesh 4,770
44 Greece (Hellenic Republic) 4,374
45 Iran, Islamic Republic of 4,163
46 Korea, Republic of (South) 4,032
47 Nigeria 3,926
48 Portugal 3,731
49 Morocco (Al Maghrib) 3,686
50 Dominica (Waitikubuli) 3,420

Total Foreign-born: 2,615,408
CSA Population: 6,832,588

U.S. Island Areas (Guam, USVI, American Samoa, CNMI) 6,362
*Miami has the largest population of people born in Cuba, Haiti & the Bahamas than any other metro outside of their countries of origin. Miami also has the largest population of immigrants from Venezuela, Nicaragua & Argentina of any metro in North America. It also has the 2nd largest population born in Jamaica outside of Jamaica (the 1st is NYC).

Top 40 newly added legal permanent residents by country of birth

Miami-Fort Lauderdale-West Palm Beach, FL 2017

1 Cuba 36,786
2 Haiti 7,116
3 Venezuela 5,226
4 Colombia 3,863
5 Jamaica 3,485
6 Dominican Republic 2,210
7 Brazil 2,174
8 Mexico 1,411
9 Peru 1,353
10 Honduras 1,321

11 Nicaragua 1,116
12 Argentina 963
13 Philippines 846
14 China, People's Republic 785
15 Ecuador 721
16 Spain 621
17 El Salvador 562
18 Guatemala 562
19 India 489
20 Russia 439

21 Canada 412
22 Italy 388
23 France 378
24 Vietnam 368
25 Chile 307
26 Bangladesh 300
27 United Kingdom 283
28 Trinidad and Tobago 266
29 Bahamas 265
30 Pakistan 231

31 Ukraine 231
32 Israel 207
33 Uruguay 200
34 Costa Rica 179
35 Guyana 159
36 Iran 155
37 Romania 154
38 Germany 151
39 Turkey 151
40 Nigeria 121

Total CBSA/MSA or Combined Tallied & Represented of CSA above: 80,133
Total CSA or MSA Legal Permanent Residents: 81,714
Total Legal Permanent Residents by Country of Birth
Source: U.S. Department of Homeland Security.

...off we go to a neighboring state to the north -- Georgia and the city of...
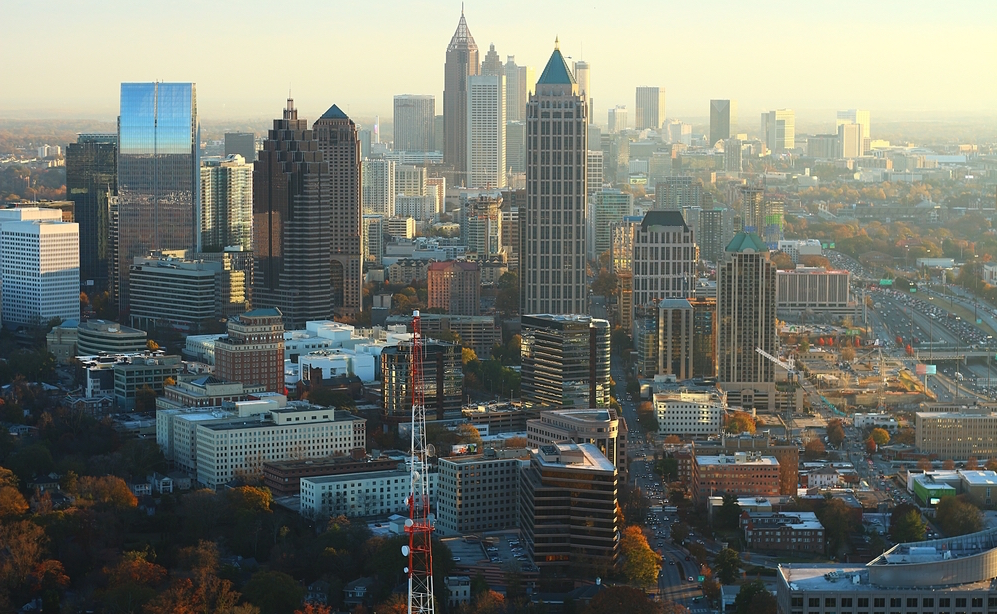

Image Source: karenatlantahomes.com

Top 50 Non-United States countries or places of birth
*Puerto Rico included in Top 50 (but not considered foreign-born)

Atlanta, United States 2017

1 México (Estados Unidos Mexicanos) 180,709
2 India (Bhārat) 89,084
3 Korea, Republic of (South) 38,752
4 Vietnam (Việt Nam), Socialist Republic of 38,128
5 Jamaica 37,922
6 China, People's Republic of 29,516
7 Guatemala 26,170
8 El Salvador 22,275
9 Nigeria 21,904
10 Puerto Rico 19,445

11 United Kingdom 17,367
12 Colombia 16,899
13 Canada 15,203
14 Dominican Republic (República Dominicana) 14,477
15 Honduras 14,312
16 Brasil 13,265
17 Ethiopia 12,531
18 Philippines (Pilipinas), Republic of the 12,046
19 Germany (Deutschland) 9,588
20 Venezuela, Bolivarian Republic of 9,441

21 Haïti 9,440
22 Bangladesh 9,146
23 Russian Federation (Russia) 8,718
24 Guyana 8,336
25 Cuba 7,724
26 Ghana 7,583
27 Pakistan 7,181
28 Iran, Islamic Republic of 6,935
29 Myanmar (Burma) 6,802
30 Romania (România) 6,230

31 Perú 5,805
32 Kenya 5,556
33 Japan 5,183
34 South Africa, Republic of 4,989
35 Israel (Yisra'el) 4,921
36 Trinidad and Tobago 4,839
37 Ukraine 4,390
38 Panamá 4,296
39 Lao People's Democratic Republic (Laos) 4,181
40 Cameroon 3,987

41 Ecuador 3,979
42 Taiwan 3,919
43 Thailand 3,913
44 Liberia 3,720
45 Nicaragua 3,720
46 Iraq 3,711
47 France 3,614
48 Italy (Italia) 3,328
49 Egypt, Arab Republic of 3,093
50 Barbados 3,074

Total Foreign-born: 887,154
CSA Population: 6,551,336

U.S. Island Areas (Guam, USVI, American Samoa, CNMI) 5,119

Top 40 newly added legal permanent residents by country of birth

Atlanta-Sandy Springs-Roswell, GA 2017

1 Mexico 2,201
2 India 1,948
3 Vietnam 1,139
4 China, People's Republic 925
5 Nigeria 881
6 Jamaica 864
7 Korea, South 844
8 Ethiopia 779
9 Burma 596
10 Colombia 472

11 Bangladesh 423
12 Pakistan 386
13 Brazil 381
14 Ghana 366
15 El Salvador 348
16 Congo, Democratic Republic 340
17 Iran 339
18 Dominican Republic 322
19 Afghanistan 288
20 Haiti 277

21 Nepal 268
22 Philippines 250
23 United Kingdom 234
24 Honduras 228
25 Guatemala 226
26 Venezuela 226
27 Kenya 218
28 Cuba 205
29 Malaysia 202
30 Canada 199

31 Cameroon 186
32 Bhutan 181
33 Peru 170
34 Iraq 166
35 Liberia 130
36 Thailand 126
37 South Africa 122
38 Israel 113
39 Russia 109
40 Cote d'Ivoire 103

Total CBSA/MSA or Combined Tallied & Represented of CSA above: 21,341
Total CSA or MSA Legal Permanent Residents: 22,416
Total Legal Permanent Residents by Country of Birth
Source: U.S. Department of Homeland Security.

...after a quick stop down south off we go even further north to the Great Lakes to a city that has been nicknamed Motor City and Motown it's also a city that introduced techno to the world...


Image Source: alannastlaurent.com

Top 50 Non-United States countries or places of birth
*Puerto Rico included in Top 50 (but not considered foreign-born)

Detroit, United States 2017

1 India (Bhārat) 64,842
2 Iraq 54,524
3 México (Estados Unidos Mexicanos) 41,375
4 Canada 26,323
5 China, People's Republic of 23,966
6 Yemen (Al Yaman) 20,539
7 Lebanese Republic (Lebanon) 19,982
8 Bangladesh 17,367
9 Philippines (Pilipinas), Republic of the 15,495
10 Korea, Republic of (South) 13,485

11 Germany (Deutschland) 13,017
12 Albania (Shqiperia) 11,273
13 Poland (Polska) 10,307
14 United Kingdom 9,639
15 Puerto Rico 9,264
16 Pakistan 8,205
17 Romania (România) 7,805
18 Japan 7,448
19 Syrian Arab Republic (Syria) 7,060
20 Italy (Italia) 6,229

21 Jordan (Al Urdun) 5,917
22 Russian Federation (Russia) 5,773
23 Nigeria 5,039
24 Brasil 4,486
25 Macedonia (Makedonija), The former Yugoslav Republic of 4,124
26 Ukraine 4,057
27 Taiwan 3,986
28 Bosnia and Herzegovina 3,976
29 Vietnam (Việt Nam), Socialist Republic of 3,843
30 Jamaica 3,299

31 Iran, Islamic Republic of 3,010
32 Saudi Arabia 2,829
33 Greece (Hellenic Republic) 2,472
34 France 2,362
35 Egypt, Arab Republic of 2,305
36 El Salvador 2,187
37 Guatemala 2,120
38 Colombia 1,915
39 Lao People's Democratic Republic (Laos) 1,861
40 Australia 1,588

41 Thailand 1,547
42 Israel (Yisra'el) 1,520
43 Bulgaria (Balgariya) 1,310
44 Spain (España) 1,270
45 Kuwait (Al Kuwayt) 1,261
46 Indonesia 1,212
47 Singapore 1,200
48 Perú 1,181
49 Honduras 1,177
50 Netherlands (Nederland) 1,119

Total Foreign-born: 506,927
CSA Population: 5,336,286

U.S. Island Areas (Guam, USVI, American Samoa, CNMI) 795
*Detroit currently has the largest population of immigrants born in Iraq in all of the Americas and one of the largest (if not the largest) populations of immigrants born in Yemen in the Americas.

Top 40 newly added legal permanent residents by country of birth

Detroit-Warren-Dearborn, MI 2017

1 Iraq 1,527
2 Yemen 1,168
3 India 991
4 Bangladesh 966
5 Mexico 790
6 Albania 699
7 Lebanon 640
8 China, People's Republic 383
9 Syria 358
10 Pakistan 334

11 Canada 332
12 Philippines 301
13 Ukraine 229
14 Vietnam 226
15 Jordan 217
16 Korea, South 215
17 Nigeria 199
18 Romania 128
19 Egypt 114
20 Germany 108

21 Brazil 103
22 Saudi Arabia 96
23 United Kingdom 94
24 Jamaica 85
25 Dominican Republic 83
26 Iran 73
27 Italy 68
28 Japan 60
29 Kuwait 60
30 Russia 60

31 Macedonia 57
32 Afghanistan 53
33 Nepal 53
34 Poland 50
35 Cameroon 47
36 United Arab Emirates 46
37 France 42
38 Morocco 42
39 Turkey 38
40 Thailand 35

Total CBSA/MSA or Combined Tallied & Represented of CSA above: 12,310
Total CSA or MSA Legal Permanent Residents: 13,726
Total Legal Permanent Residents by Country of Birth
Source: U.S. Department of Homeland Security.

...next stop? We're heading to the great northwest to the home of Starbucks, Amazon & Microsoft...it's a city that is growing very fast with an ever changing skyline and population...


Image Source: fm.cnbc.com

Top 50 Non-United States countries or places of birth
*Puerto Rico included in Top 50 (but not considered foreign-born)

Seattle, United States 2017

1 México (Estados Unidos Mexicanos) 107,492
2 India (Bhārat) 76,083
3 Philippines (Pilipinas), Republic of the 69,348
4 China, People's Republic of 67,118
5 Vietnam (Việt Nam), Socialist Republic of 53,362
6 Korea, Republic of (South) 38,614
7 Canada 29,360
8 Ukraine 25,260
9 Ethiopia 20,167
10 Russian Federation (Russia) 14,700

11 United Kingdom 14,657
12 Japan 14,237
13 Germany (Deutschland) 13,087
14 Taiwan 12,294
15 Cambodia (Kampuchea) 12,144
16 Guatemala 11,440
17 El Salvador 10,011
18 Thailand 9,100
19 Iran, Islamic Republic of 7,809
20 China, Hong Kong (Special Administrative Region) 6,961

21 Kenya 6,524
22 Puerto Rico 5,683
23 Indonesia 5,671
24 Brasil 5,618
25 Somalia 5,398
26 Eritrea (Ertra) 5,171
27 Romania (România) 4,914
28 Moldova, Republic of 4,831
29 France 4,421
30 Poland (Polska) 4,261

31 Lao People's Democratic Republic (Laos) 4,194
32 Turkey (Türkiye) 3,918
33 Iraq 3,631
34 Israel (Yisra'el) 3,608
35 Nepal 3,581
36 Perú 3,520
37 Colombia 3,516
38 Australia 3,124
39 Pakistan 3,117
40 Honduras 2,954

41 Netherlands (Nederland) 2,821
42 South Africa, Republic of 2,776
43 Belarus 2,484
44 Egypt, Arab Republic of 2,469
45 Malaysia 2,352
46 Spain (España) 2,167
47 Myanmar (Burma) 2,139
48 Italy (Italia) 1,990
49 Ecuador 1,978
50 Chile 1,899

Total Foreign-born: 795,401
CSA Population: 4,764,736

U.S. Island Areas (Guam, USVI, American Samoa, CNMI) 18,293 *It has recently become one of the most popular destinations for Chamorro from Guam & the Northern Mariana Islands and migrants from American Samoa.

Top 40 newly added legal permanent residents by country of birth

Seattle-Tacoma-Bellevue, WA 2017

1 China, People's Republic 1,896
2 Vietnam 1,647
3 Mexico 1,541
4 India 1,468
5 Ethiopia 1,140
6 Philippines 1,139
7 Afghanistan 851
8 Korea, South 685
9 Ukraine 674
10 Canada 592

11 Iran 449
12 Iraq 436
13 Russia 418
14 Somalia 355
15 Kenya 327
16 Cambodia 318
17 United Kingdom 283
18 Nepal 258
19 Pakistan 256
20 Taiwan 225

21 Brazil 220
22 Eritrea 213
23 Egypt 193
24 Japan 191
25 Moldova 190
26 El Salvador 169
27 Australia 162
28 Burma 156
29 Romania 150
30 Thailand 148

31 Hong Kong 147
32 Gambia 129
33 Israel 126
34 Turkey 122
35 Congo, Democratic Republic 109
36 France 107
37 South Africa 105
38 Germany 101
39 Nigeria 97
40 Ghana 88

Total CBSA/MSA or Combined Tallied & Represented of CSA above: 20,814
Total CSA or MSA Legal Permanent Residents: 21,936
Total Legal Permanent Residents by Country of Birth
Source: U.S. Department of Homeland Security.

From the evergreen northwest we head south to the the desert southwest to...


Image Source: mountainalarm.com

Top 50 Non-United States countries or places of birth
*Puerto Rico included in Top 50 (but not considered foreign-born)

Phoenix, United States 2017

1 México (Estados Unidos Mexicanos) 339,400
2 India (Bhārat) 41,171
3 Canada 29,876
4 Philippines (Pilipinas), Republic of the 25,590
5 Vietnam (Việt Nam), Socialist Republic of 17,313
6 China, People's Republic of 16,424
7 Guatemala 15,200
8 United Kingdom 13,005
9 Iraq 11,590
10 Germany (Deutschland) 8,657

11 Puerto Rico 8,555
12 Korea, Republic of (South) 6,364
13 Romania (România) 6,018
14 Cuba 5,098
15 El Salvador 4,605
16 Poland (Polska) 4,561
17 Russian Federation (Russia) 4,120
18 Iran, Islamic Republic of 4,046
19 Japan 3,664
20 Taiwan 3,408

21 Perú 3,330
22 Colombia 3,256
23 Italy (Italia) 3,054
24 Bosnia and Herzegovina 2,744
25 Netherlands (Nederland) 2,716
26 Honduras 2,705
27 Syrian Arab Republic (Syria) 2,605
28 Thailand 2,428
29 Brasil 2,424
30 Kenya 2,372

31 Myanmar (Burma) 2,213
32 France 2,203
33 South Africa, Republic of 2,147
34 Ireland, Republic of (Éire) 2,097
35 Dominican Republic (República Dominicana) 1,887
36 Nicaragua 1,883
37 China, Hong Kong (Special Administrative Region) 1,882
38 Ethiopia 1,855
39 Kuwait (Al Kuwayt) 1,682
40 Bulgaria (Balgariya) 1,673

41 Pakistan 1,666
42 Argentine Republic (Argentina) 1,610
43 Ukraine 1,586
44 Venezuela, Bolivarian Republic of 1,580
45 Haïti 1,578
46 Israel (Yisra'el) 1,571
47 Cambodia (Kampuchea) 1,562
48 Saudi Arabia 1,551
49 Liberia 1,541
50 Spain (España) 1,526

Total Foreign-born: 673,330
MSA Population: 4,737,270

U.S. Island Areas (Guam, USVI, American Samoa, CNMI) 3,640

Top 40 newly added legal permanent residents by country of birth

Phoenix-Mesa-Scottsdale, AZ 2017

1 Mexico 5,551
2 India 629
3 Philippines 527
4 Cuba 526
5 Iraq 484
6 Vietnam 456
7 China, People's Republic 397
8 Congo, Democratic Republic 265
9 Canada 254
10 Burma 246

11 Afghanistan 214
12 Ethiopia 147
13 Iran 127
14 Korea, South 126
15 Guatemala 123
16 Malaysia 114
17 Colombia 111
18 United Kingdom 108
19 Syria 104
20 Thailand 103

21 Somalia 101
22 Nigeria 99
23 Pakistan 96
24 El Salvador 95
25 Rwanda 94
26 Romania 84
27 Kenya 73
28 Brazil 72
29 Sudan 72
30 Venezuela 71

31 Nepal 66
32 Cameroon 64
33 Dominican Republic 64
34 Costa Rica 62
35 Burundi 61
36 Congo, Republic 61
37 Honduras 61
38 Jordan 59
39 Jamaica 58
40 Albania 57

Total CBSA/MSA or Combined Tallied & Represented of MSA above: 13,556
Total CSA or MSA Legal Permanent Residents: 13,556
Total Legal Permanent Residents by Country of Birth
Source: U.S. Department of Homeland Security.

...and last but not least for tonight we visit the Twin Cities!!


Image Source: wikimedia.org

Top 50 Non-United States countries or places of birth
*Puerto Rico included in Top 50 (but not considered foreign-born)

Minneapolis-St. Paul, United States 2017

1 México (Estados Unidos Mexicanos) 48,987
2 Somalia 34,350
3 India (Bhārat) 27,043
4 Ethiopia 26,442
5 Lao People's Democratic Republic (Laos) 23,409
6 Thailand 17,762
7 Vietnam (Việt Nam), Socialist Republic of 15,832
8 China, People's Republic of 13,910
9 Liberia 13,585
10 Korea, Republic of (South) 12,762

11 Kenya 11,970
12 Philippines (Pilipinas), Republic of the 8,281
13 Canada 8,142
14 Myanmar (Burma) 7,146
15 Ecuador 6,898
16 El Salvador 5,984
17 Russian Federation (Russia) 5,836
18 United Kingdom 5,634
19 Nigeria 5,391
20 Germany (Deutschland) 5,342

21 Cambodia (Kampuchea) 5,172
22 Guatemala 5,062
23 Pakistan 3,892
24 Guyana 3,472
25 Ukraine 3,422
26 Puerto Rico 3,094
27 Eritrea (Ertra) 3,093
28 Colombia 2,952
29 Japan 2,922
30 Brasil 2,867

31 Ghana 2,708
32 Cameroon 2,680
33 China, Hong Kong (Special Administrative Region) 2,523
34 Egypt, Arab Republic of 2,225
35 Sierra Leone 2,217
36 Nepal 2,205
37 Taiwan 1,828
38 Honduras 1,737
39 South Africa, Republic of 1,694
40 Poland (Polska) 1,686

41 Morocco (Al Maghrib) 1,609
42 Bosnia and Herzegovina 1,569
43 Malaysia 1,472
44 Lebanese Republic (Lebanon) 1,256
45 Belarus 1,245
46 Venezuela, Bolivarian Republic of 1,195
47 Cuba 1,191
48 Iran, Islamic Republic of 1,181
49 Turkey (Türkiye) 1,171
50 Iraq 1,145

Total Foreign-born: 416,102
CSA Population: 3,946,533

U.S. Island Areas (Guam, USVI, American Samoa, CNMI) 411
*Minneapolis currently has the largest population of immigrants born in Somalia & Laos of any metro in the Americas.

Top 40 newly added legal permanent residents by country of birth

Minneapolis-Saint Paul-Bloomington, MN-WI 2017

1 Somalia 1,787
2 Ethiopia 1,528
3 Mexico 1,058
4 Kenya 854
5 India 620
6 Liberia 560
7 Vietnam 514
8 Burma 480
9 Thailand 415
10 China, People's Republic 368

11 Ecuador 262
12 Philippines 261
13 Cameroon 187
14 Nigeria 149
15 Cambodia 146
16 Nepal 141
17 South Africa 129
18 Egypt 124
19 Pakistan 121
20 Ukraine 117

21 Laos 115
22 El Salvador 110
23 Ghana 98
24 Canada 89
25 Togo 84
26 Iraq 81
27 Russia 77
28 Guatemala 67
29 Afghanistan 65
30 Eritrea 62

31 Honduras 61
32 Uganda 61
33 Korea, South 59
34 Guyana 58
35 United Kingdom 58
36 Brazil 57
37 Colombia 54
38 Congo, Democratic Republic 54
39 Iran 48
40 Dominican Republic 44

Total CBSA/MSA or Combined Tallied & Represented of CSA above: 12,680
Total CSA or MSA Legal Permanent Residents: 13,876
Total Legal Permanent Residents by Country of Birth
Source: U.S. Department of Homeland Security.

....This concludes our journey across the United States for tonight...we've got at least 15 more to go before we travel across the Atlantic to Spain so stay tuned!!! Some of the US metro areas coming up are Denver, Cleveland, San Diego, Portland, Charlotte, Pittsburgh, Sacramento and others.
Reply With Quote
     
     
  #108  
Old Posted Oct 12, 2018, 12:41 PM
dave8721 dave8721 is offline
Registered User
 
Join Date: Jul 2005
Location: Miami
Posts: 4,186
For Miami, that number of Russians seems pretty low judging by what you see around town. My guess is many of the Russians are living here in practice but not officially being residents?
Reply With Quote
     
     
  #109  
Old Posted Oct 12, 2018, 1:30 PM
Urbanguy's Avatar
Urbanguy Urbanguy is offline
Go Beavs! Go Niners!
 
Join Date: Dec 2001
Location: Portland | Honolulu
Posts: 6,195
^It is highly possible most of these figures for US Cities do not take into account temporary residents including refugees/asylees or special immigrant visas (until they become permanent). In the case of refugee and asylum seekers -- cities/metros that resettled them would have even higher numbers if they were permanent which the majority, historically, have become over time. As for the Russians in Miami -- they could also be from New York especially since MIA & NYC have deep connections with expats and if you added all of the former Soviet Republics in Miami then it might fall in line with what you've seen (think Russia, Ukraine, Moldova, Estonia, Latvia, Lithuania, Kazakhstan, Kyrgyzstan, Tajikistan, Turkmenistan, Uzbekistan, Armenia, Azerbaijan and Georgia) all of which can either speak Russian and/or their native languages.
Reply With Quote
     
     
  #110  
Old Posted Oct 12, 2018, 5:19 PM
Capsicum's Avatar
Capsicum Capsicum is offline
Registered User
 
Join Date: Sep 2017
Location: Western Hemisphere
Posts: 2,489
Seeing Canada show up on the foreign born list in various US cities is interesting -- especially with the prominence of the "snowbirds" in Phoenix.

What's the largest Canadian-born population in any city outside Canada, I'm wondering? LA?

(Conversely with the US-born making the list of top immigrants in some Canadian cities, I'd be curious if the most US-born outside of the US was in Canada or elsewhere, such as in Mexico with the American-born Mexican diaspora?)
Reply With Quote
     
     
  #111  
Old Posted Oct 12, 2018, 5:20 PM
Capsicum's Avatar
Capsicum Capsicum is offline
Registered User
 
Join Date: Sep 2017
Location: Western Hemisphere
Posts: 2,489
Quote:
Originally Posted by Urbanguy View Post
^It is highly possible most of these figures for US Cities do not take into account temporary residents including refugees/asylees or special immigrant visas (until they become permanent). In the case of refugee and asylum seekers -- cities/metros that resettled them would have even higher numbers if they were permanent which the majority, historically, have become over time. As for the Russians in Miami -- they could also be from New York especially since MIA & NYC have deep connections with expats and if you added all of the former Soviet Republics in Miami then it might fall in line with what you've seen (think Russia, Ukraine, Moldova, Estonia, Latvia, Lithuania, Kazakhstan, Kyrgyzstan, Tajikistan, Turkmenistan, Uzbekistan, Armenia, Azerbaijan and Georgia) all of which can either speak Russian and/or their native languages.
I thought non-citizens with temporary visas still get counted if they're residing in a residential dwelling stateside at the time of census.

I recall that even college dorms with international and exchange students get the census as they count as dwellings.
Reply With Quote
     
     
  #112  
Old Posted Oct 12, 2018, 5:25 PM
Capsicum's Avatar
Capsicum Capsicum is offline
Registered User
 
Join Date: Sep 2017
Location: Western Hemisphere
Posts: 2,489
Quote:
Originally Posted by Urbanguy View Post
*Chicago has the largest Poland-born population of any metro area in all of the Americas.

Top 40 newly added legal permanent residents by country of birth

Chicago-Naperville-Elgin, IL-IN-WI 2017

1 Mexico 9,596
2 India 3,713
3 China, People's Republic 1,793
4 Philippines 1,667
5 Poland 1,504
6 Pakistan 1,123
7 Ukraine 1,090
8 Nigeria 679
9 Vietnam 646
10 Jordan 624
Chicago's interesting as it's one of the few (big) cities in the US with still European-origin immigration significantly making it in the top 10 (Poland and Ukraine).

I don't think that any other major cities stateside have Europeans still immigrating proportionally that much.

(I know in terms of cities in Canada, the UK and Australia, European source countries can still make the list, but stateside, these immigrant sources have generally fallen behind Asia and the Americas as places of origin)
Reply With Quote
     
     
  #113  
Old Posted Oct 12, 2018, 5:31 PM
Capsicum's Avatar
Capsicum Capsicum is offline
Registered User
 
Join Date: Sep 2017
Location: Western Hemisphere
Posts: 2,489
Quote:
Originally Posted by Commentariat View Post
That’s a pretty random list at the top for the world’s number one immigration magnet. Dominican Republic, Puerto Rico, Jamaica, Ecuador, Guyana, Haiti and El Salvador have a combined population of about 50 million people, or 1 in 150 of the world’s population, but provide 1 in 3 of NYC’s immigrants. I guess it just goes to show the power of chain migration, which is evident in many of the cities and countries in this thread.
Well, not that random, geographically speaking. NYC (along with more prominently, Miami) have an east coast/eastern seaboard immigration trend going on where it's clear the Americas (Caribbean, Central and South America) as a region is dominating the flow more than places more inland or out west.

Though summed up through all its history, NYC does have, as world's number one immigration magnet, a storied history of immigration from nearly all the major world regions (Asia, Africa, the Americas especially nowadays) and Europe during the Ellis Island years of course.
Reply With Quote
     
     
  #114  
Old Posted Oct 12, 2018, 5:58 PM
McBane McBane is offline
Registered User
 
Join Date: Sep 2006
Location: Philadelphia
Posts: 3,707
Quote:
Originally Posted by Urbanguy View Post
^It is highly possible most of these figures for US Cities do not take into account temporary residents including refugees/asylees or special immigrant visas (until they become permanent). In the case of refugee and asylum seekers -- cities/metros that resettled them would have even higher numbers if they were permanent which the majority, historically, have become over time. As for the Russians in Miami -- they could also be from New York especially since MIA & NYC have deep connections with expats and if you added all of the former Soviet Republics in Miami then it might fall in line with what you've seen (think Russia, Ukraine, Moldova, Estonia, Latvia, Lithuania, Kazakhstan, Kyrgyzstan, Tajikistan, Turkmenistan, Uzbekistan, Armenia, Azerbaijan and Georgia) all of which can either speak Russian and/or their native languages.
Yes. Philadelphia is also a magnet for "Russians" but their numbers are diluted across what you accurately termed as the "former Soviet Republics" even though most speak Russian.
Reply With Quote
     
     
  #115  
Old Posted Oct 12, 2018, 7:26 PM
Crawford Crawford is online now
Registered User
 
Join Date: Nov 2003
Location: Brooklyn, NYC/Polanco, DF
Posts: 34,794
Quote:
Originally Posted by McBane View Post
Yes. Philadelphia is also a magnet for "Russians" but their numbers are diluted across what you accurately termed as the "former Soviet Republics" even though most speak Russian.
I'm willing to wager that most "Russians" in the U.S. aren't from Russia but rather former Soviet. They just call themselves Russian because that's their ethnicity and most Americans would probably be clueless if they said they're from Belarus or Uzbekistan.
Reply With Quote
     
     
  #116  
Old Posted Oct 12, 2018, 7:30 PM
Crawford Crawford is online now
Registered User
 
Join Date: Nov 2003
Location: Brooklyn, NYC/Polanco, DF
Posts: 34,794
Quote:
Originally Posted by Capsicum View Post
Chicago's interesting as it's one of the few (big) cities in the US with still European-origin immigration significantly making it in the top 10 (Poland and Ukraine).
Yes, but this population is probably pretty old. Not many Poles or Ukrainians coming to U.S. in 2018, especially with Schengen.

Why would anyone spend 10k and wait years on an uncertain lottery when they can move to neighboring Germany tomorrow, and visit Mama on weekends? Even with higher salaries and spending power in U.S. it isn't worth it.

The only way the U.S. gets a large new wave of European immigration is if the EU splinters (which isn't implausible).
Reply With Quote
     
     
  #117  
Old Posted Oct 12, 2018, 7:31 PM
JManc's Avatar
JManc JManc is offline
Administrator
 
Join Date: Feb 2003
Location: Houston
Posts: 22,723
Obligatory...

Video Link
__________________
Who are you people and where is my horse? - G. Carlin
Reply With Quote
     
     
  #118  
Old Posted Oct 13, 2018, 12:53 AM
Urbanguy's Avatar
Urbanguy Urbanguy is offline
Go Beavs! Go Niners!
 
Join Date: Dec 2001
Location: Portland | Honolulu
Posts: 6,195
Quote:
Originally Posted by Capsicum View Post
I thought non-citizens with temporary visas still get counted if they're residing in a residential dwelling stateside at the time of census.

I recall that even college dorms with international and exchange students get the census as they count as dwellings.
According to the US Census: Foreign-born immigrants are foreign-born people whose usual place of residence is in the United States. So yes, if their usual place of residence is in the US. If it’s only part of the year (or below a certain threshold) then not necessarily so. A place like Miami attracts a lot of wealthy temporary/part time residents.
Reply With Quote
     
     
  #119  
Old Posted Oct 13, 2018, 1:02 AM
Urbanguy's Avatar
Urbanguy Urbanguy is offline
Go Beavs! Go Niners!
 
Join Date: Dec 2001
Location: Portland | Honolulu
Posts: 6,195
Quote:
Originally Posted by Capsicum View Post
Well, not that random, geographically speaking. NYC (along with more prominently, Miami) have an east coast/eastern seaboard immigration trend going on where it's clear the Americas (Caribbean, Central and South America) as a region is dominating the flow more than places more inland or out west.

Though summed up through all its history, NYC does have, as world's number one immigration magnet, a storied history of immigration from nearly all the major world regions (Asia, Africa, the Americas especially nowadays) and Europe during the Ellis Island years of course.
Actually, in the case of immigration from Europe to NYC — it did extend beyond the historical days of Ellis Island as many immigrants from Eastern Europe & especially the former Soviet Union migrated to NYC in very large numbers after the break up of the USSR & the “fall” of communism.
Reply With Quote
     
     
  #120  
Old Posted Oct 13, 2018, 1:25 AM
Acajack's Avatar
Acajack Acajack is offline
Gros Méchant Loup
 
Join Date: Aug 2006
Location: Province 2, Canadian Empire
Posts: 72,949
Quote:
Originally Posted by Capsicum View Post
Seeing Canada show up on the foreign born list in various US cities is interesting -- especially with the prominence of the "snowbirds" in Phoenix.

What's the largest Canadian-born population in any city outside Canada, I'm wondering? LA?

(Conversely with the US-born making the list of top immigrants in some Canadian cities, I'd be curious if the most US-born outside of the US was in Canada or elsewhere, such as in Mexico with the American-born Mexican diaspora?)
Places like Hong Kong and Beirut have lots of Canadians living there too, but they're not generally people with names like Bob MacKenzie and Pierre Tremblay.

Likewise, statistics show that about 70% of "Americans" living in Quebec are actually French speakers. This isn't about Randy Culpepper from Alabama moving to Montreal and assimilating to French, but rather about Jean-Paul Pelletier who was born in Manchester NH or Woonsocket RI moving to Quebec as a child with his parents who went back home after a stint in the U.S.
__________________
Loin des yeux, loin du coeur.
Reply With Quote
     
     
This discussion thread continues

Use the page links to the lower-right to go to the next page for additional posts
 
 
Reply

Go Back   SkyscraperPage Forum > Discussion Forums > City Discussions
Forum Jump


Forum Jump


All times are GMT. The time now is 3:44 PM.

     
SkyscraperPage.com - Privacy Statement - Top

Powered by vBulletin® Version 3.8.7
Copyright ©2000 - 2026, vBulletin Solutions, Inc.