The Q1 2017 ridership reports are out:
http://www.apta.com/resources/statistics/Documents/Ridership/2017-q1-ridership-APTA.pdf
Below are the highlights:
Bus: 73.5K average daily, down 1.64% (73.5K is correct, not the 160.5K as shown on the report).
Trax: 62.4K average daily, down 0.57%
FrontRunner: 17.6K average daily, up 8.53%
Total: 162.1K average daily, down 0.41%
The numbers are year over year, Q1 over Q1, 2017 over 2016.
The biggest point of the above is that Frontrunner has tied its best quarterly performance of Q4 2015. It is also the first Q4 to Q1 growth since Q1 2014.
This is great as Q4 is generally the highest ridership time for UTA.
I do think it will be nice to see if this trend continues. Historically, Q2 has lower ridership than Q1. Q3 is when ridership increases again.
We should be nearing a tipping point towards gradual increases as the decreases are starting to get smaller or going positive again (Trax/Frontrunner).
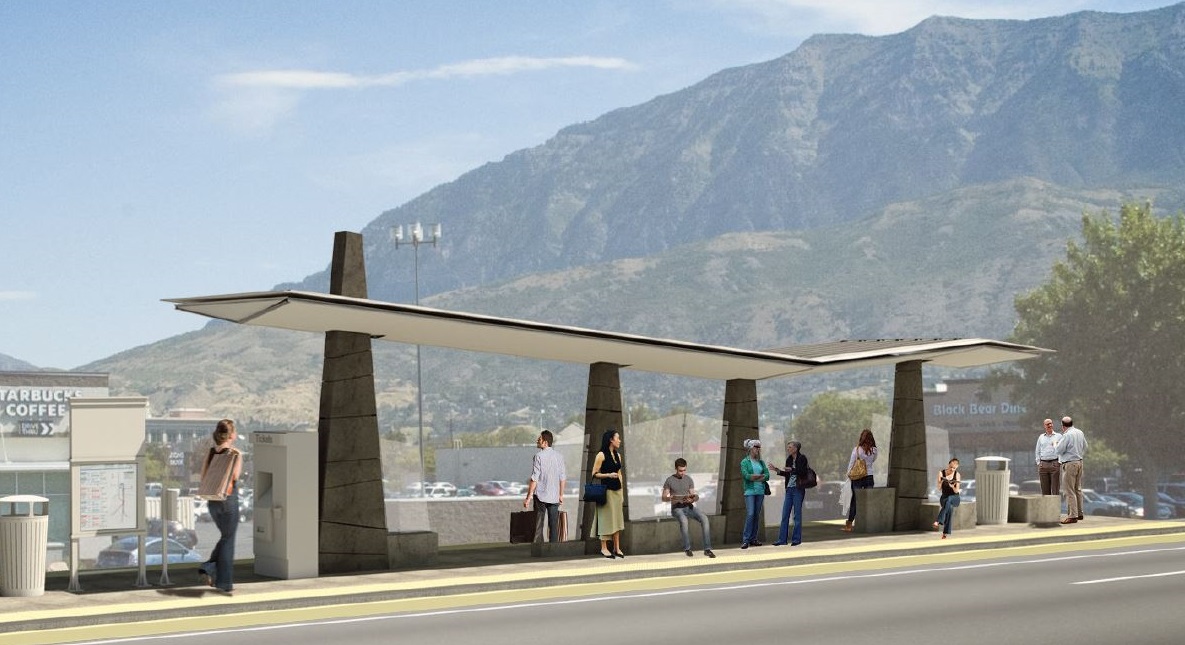
Bus service is stuck in a rut of sorts and has only a few ways towards increased ridership: Tax increase for service, Projects over time such as Provo/Orem BRT (1 project every 5 to 7 years), or a larger scale realignment to focus on higher density and higher propensity for ridership (this option is a non-starter due to potential service losses in many areas).





 Prev
Prev




 Linear Mode
