I'm surprised
this other thread didn't gain any traction. For a demographics geek like me, I found
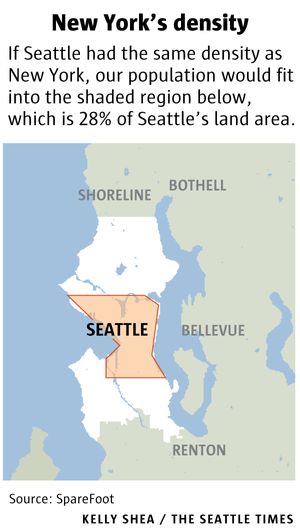
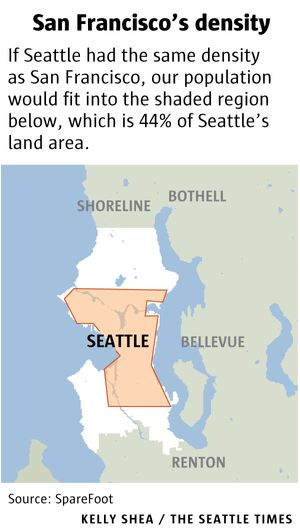
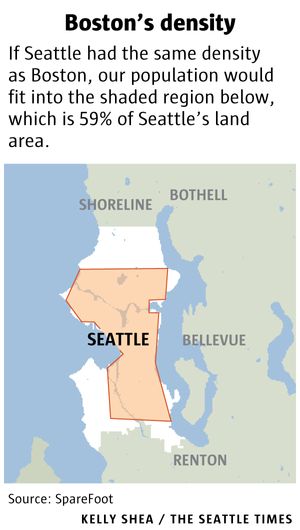
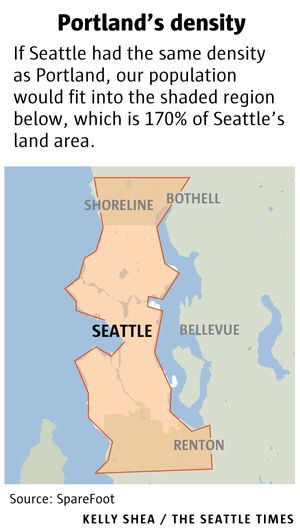
this interactive tool to be very fascinating. I’ve literally wasted hours comparing cities. In particular, I found the population density graph to be the most interesting (unfortunately you have to scroll down to the bottom for it). When you look at Seattle, you can see how the downtown population density has exploded over the past 25 years, while the rest of the metropolis has remained relatively stable. There are a lot of cities that look like that – mostly the boomtowns. In rust-belt cities like Pittsburgh, Cleveland, Columbus, etc., you find reduced density in the core. There are some surprises. Apparently downtown Minneapolis has really been booming. I never see Minneapolis mentioned in any of the countless articles about the booming downtowns of America, so I had no idea. I assumed Minneapolis had been a stable, low-growth city in recent years – sort of like Milwaukee. Speaking of Milwaukie, it’s much denser than I realized. And there are cities like Kansas City that have shockingly less density than I expected (Kansas City’s density never gets above about 3200 per square mile at any point on the graph).
I’m not completely sure about the accuracy of the data, and I don’t know if they accounted for bodies of water, etc., but it’s fascinating to look at anyway.


 Prev
Prev


 Linear Mode
