Easy reference map to spot census tracts that I mention:
https://www2.census.gov/geo/maps/dc1...C49035_001.pdf
Warning, probably boring post ahead.
I actually had 2010 population information for census tracts readily available for a school project that I did, so it was pretty easy to put those in a spreadsheet, add the 2020 census figures, and see population changes.
There are 54 census tracts that are more or less wholly within the borders of Salt Lake City. One of these is a west side tract that has just 16 people, so I threw that out, leaving 53. This doesn't count 2 other far west side census tracts which cross over into Magna and West Valley City, where I assume most or all of the population of those census tracts reside. Also, given the weird boundaries with Millcreek on the southeast side of the city, there are a few that are primarily in Millcreek but have small portions in Salt Lake City.
The 53 census tracts are actually 2 more than existed in 2010. When an area reaches a certain population (approximately 5,000-6,000, though it's not a set number) the Census Bureau splits them and just adds numbers to the end. In this case, the two that were split were Census Tract 1025 (into 1025.01 and 1025.02), which covers the western downtown area (between North Temple and 400 South, and I-15 and West Temple) and Census Tract 1014, which covers the University of Utah campus. Luckily, because they're split and not combined with neighboring census tracts, you can simply combine the 2020 census figures for both of them and directly compare them to 2010 numbers.
Out of the 51 census tracts from 2010, 31 of them gained population and 20 of them lost population. Of the 31 that gained, 11 of them grew more than 10%, and 6 grew more than 50%.
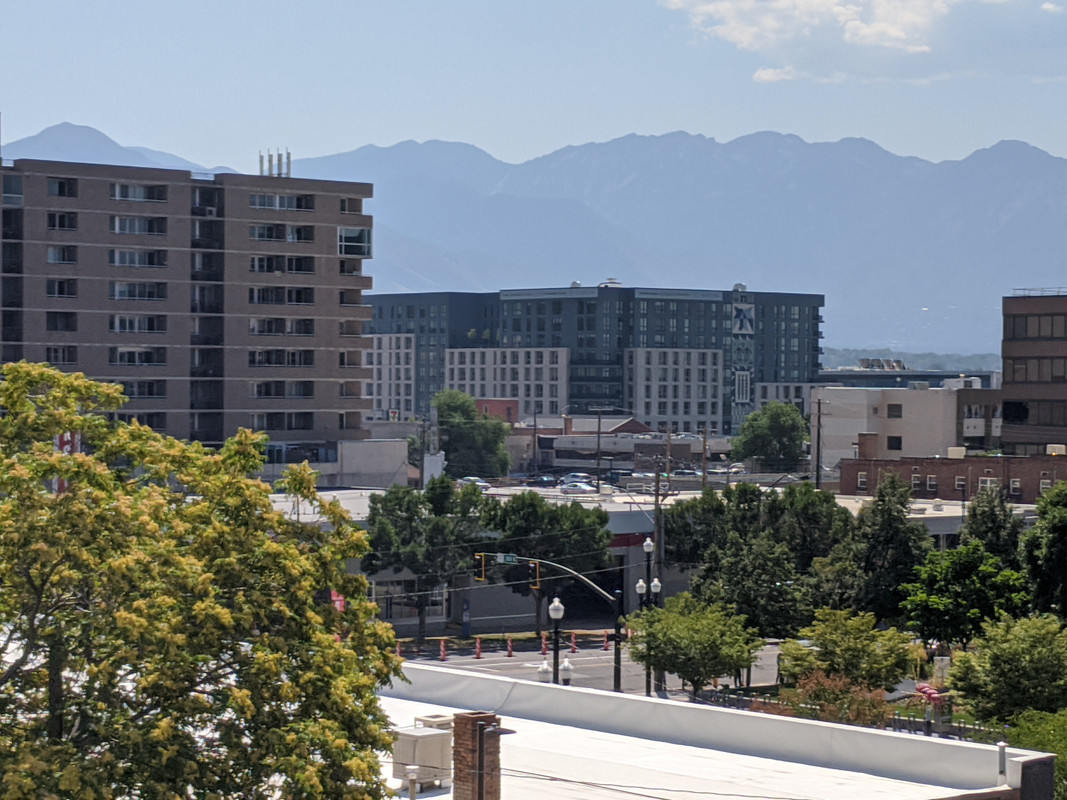
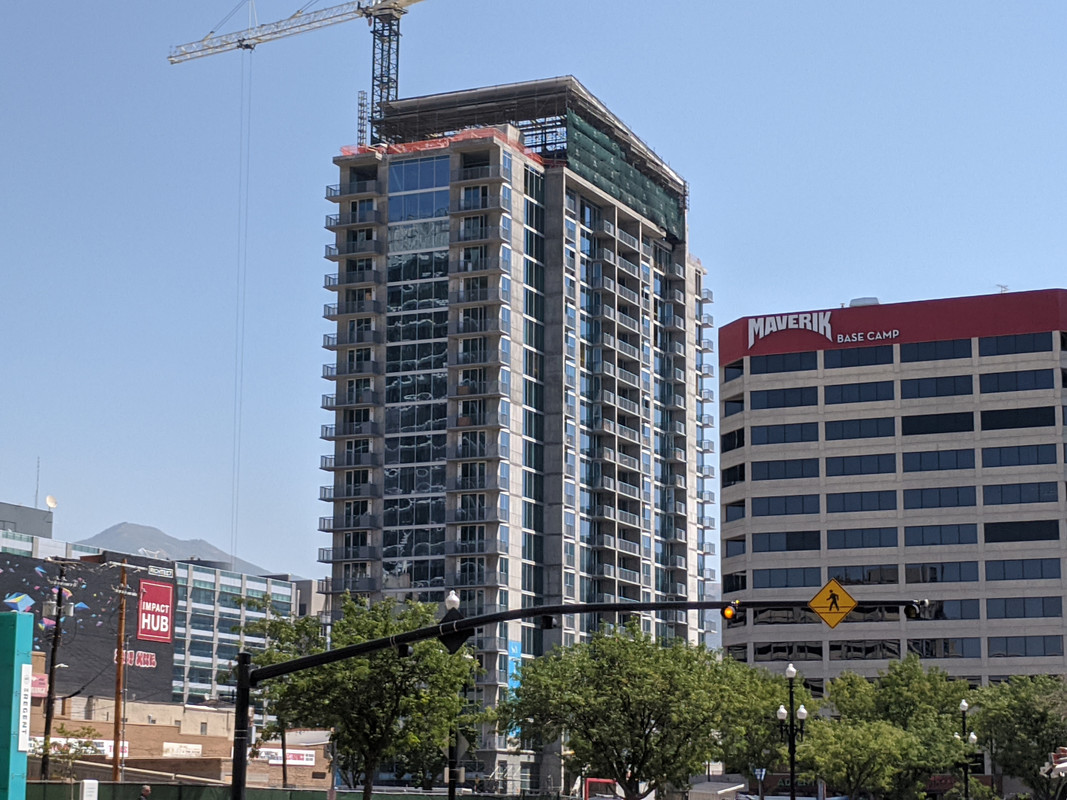
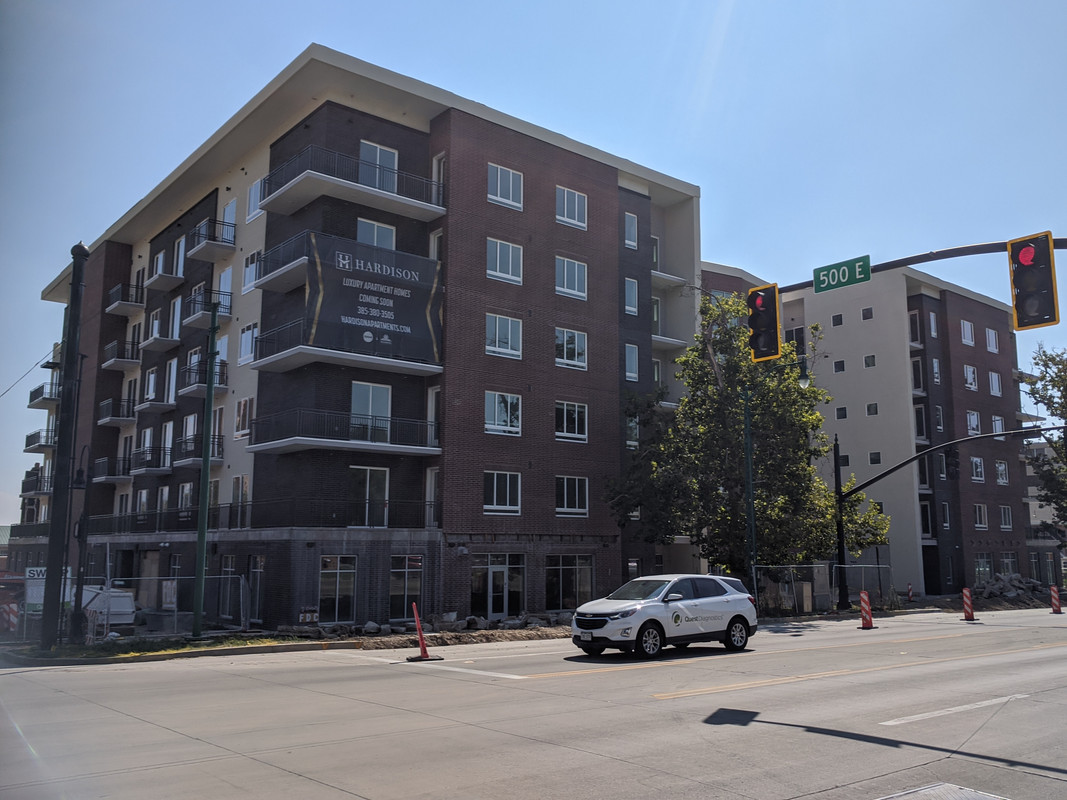
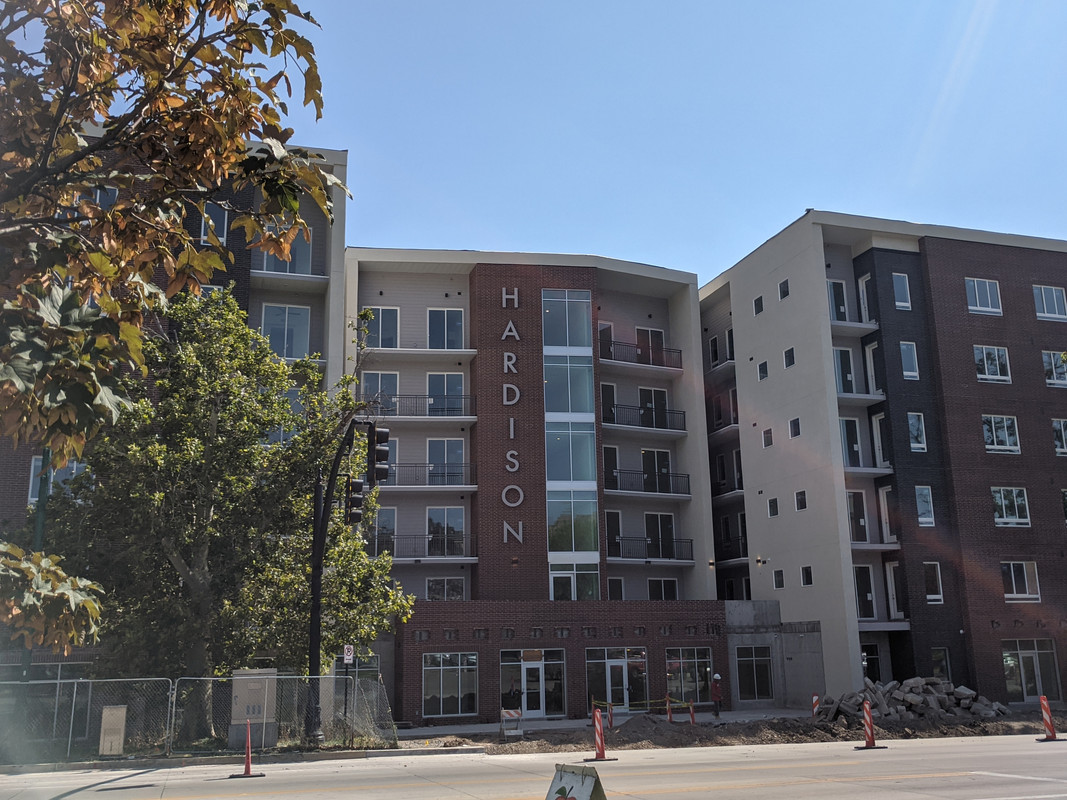
From what I can see, the ones that grew rapidly more or less aligns with what we would expect. By far the fastest growing census tract was Census Tract 1140, which covers the downtown core and the Granary District (more specifically, from I-15 to State Street, and 400 South to 900 South, but with a small part extending north to South Temple between West Temple and 200 East). This census tract grew from 1,501 to 4,344, a whopping 189.4% increase. With projects like Liberty Sky and Astra being in here, and continued rapid growth in the Granary District, I would expect this one to be split by 2030 and to be among the fastest growing again.
These are the 10 fastest-growing, if you want to reference them on the map above:
1) 1140 - 189.4% (CBD and Granary district)
2) 1001 - 95.4% (Hardware/west Marmalade)
3) 1021 - 63.2% (east Downtown; S Temple - 400 S, 200 E - 400 E)
4) 1141 - 55.1% (Sugarhouse core)
5) 1148 - 53.0% (Upper Avenues/Federal Heights; I can't really explain this one, anyone else know? Was there some rich person subdivision built that I don't know about?)
6) 1140 - 50.2% (west Downtown/Gateway)
7) 1016 - 41.0% (University of Utah)
8) 1029 - 28.2% (South Central 9th/Ballpark/south 300 West corridor)
9) 1019 - 24.3% (S Temple - 400 S, 400 E - 700 E)
10) 1003.06 - 19.4% (southwest Rose Park/west North Temple corridor)
In summary, the highest growing areas were concentrated around Downtown, along the 400 South corridor, and in Sugarhouse, which is exactly what you would expect. The huge increase right around downtown is especially encouraging, as almost all of those census tracts increased substantially in population.
The census tracts that lost population, surprisingly, were just as much on the west side as on the east. In fact, the far east tracts mostly increased a bit. The biggest drop was actually the census tract just south of the Capitol, which lost 13.4% of its population. Given the historic homes in the area that make development almost impossible, that's not too surprising. It's also a small tract, with only 2,562 people, which means it doesn't hurt downtown's overall population much.
Other than that, surprisingly nearly all of the west side census tracts lost population - 9 of the 11 west side tracts to be exact. Although I guess it shouldn't be that surprising, as those areas haven't seen much housing development at all. The only ones that grew were two along the North Temple corridor - 1003.06 and 1006. I do wonder, however, if some of those fears about low response rates among the Hispanic population ended up being true, and that there weren't major declines at all. I don't think we'll know for sure until further analysis of the results are done. If that does happen to be the case, then maybe were are over 200,000 after all (perhaps well over). I expect Salt Lake City to challenge the census figures.
Most of the others that lost population were in the central city area - near Liberty Park, and in northern and western Sugarhouse.
To sum up, out of the 20 census tracts that lost population:
- 9 are on the west side (1147, 1003.07, 1003.08, 1005, 1026, 1027.01, 1027.02, 1028.01, 1028.02)
- 9 approximately form a corridor from Liberty Park south into the Central City/west Sugarhouse area, and east through northern Sugarhouse (north of 2100 South) and up to Foothill Drive (1030, 1035, 1031, 1032, 1033, 1049, 1038, 1039, 1041)
- 2 are in the Capitol Hill/Marmalade area (1007, 1008)
The Lower Avenues and some other east side/central city areas had very very slow growth.
The fact that more than 1/3 of our census tracts lost population shows perhaps why growth still isn't where it should be. There's just not enough housing being built in certain neighborhoods. Luckily, there has been enough housing construction elsewhere to offset those losses.
Anyway, hopefully this long and boring post was interesting to some people. I was just curious myself to see if it tracked with the concensus. The surprising parts to me were that the east side mostly saw slow growth while the west side saw sometimes pretty sharp declines. The areas of rapid growth were not surprising, though it was good to see it backed up by real data to show that the apartments are making a difference. If I get some extra time, I'll try to make a map.


 Prev
Prev


 Linear Mode
