^^
Thank you guys! You're kind!

------------------------------------------------------------------------------
Downtown Pittsburgh
 ------------------------------ 2020 ------ 2010 ------ 2000 ------ 1990 ------ Growth ------ Density
Downtown ----------------------- 4,729 ------ 2,831 ------ 4,364 ------ 3,114 ---- 67.0% --- -35.1% --- 40.1% ------- 1.4 km² --- 3,331.6 inh./km²
Central Pittsburgh ------------- 15,497 ----- 13,101 ----- 12,195 ------ 9,739 ---- 18.3% ----- 7.4% --- 25.2% ------- 4.8 km² --- 3,225.2 inh./km²
Pittsburgh -------------------- 302,971 ---- 305,306 ---- 334,325 ---- 369,962 ---- -0.8% ---- -8.7% --- -9.6% ----- 143.4 km² --- 2,112.8 inh./km²
Allegheny County ---------- 1,250,578 -- 1,223,348 -- 1,281,666 -- 1,336,449 ----- 2.2% ---- -4.6% --- -4.1% --- 1.891 km² ------- 601.3 inh./km²
Pittsburgh MSA ------------ 2,370,930 -- 2,356,285 -- 2,431,088 -- 2,468,289 ----- 0.6% ---- -3.1% --- -1.5% -- 13,683 km²
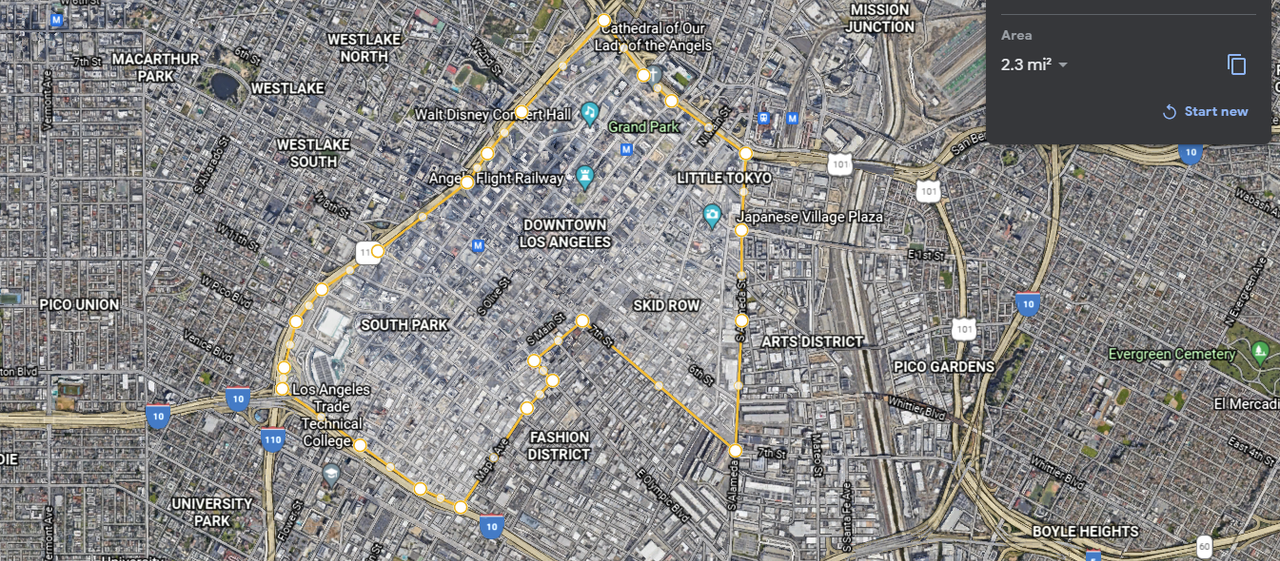
Downtown Pittsburgh, the Golden Triangle, is so tiny that comprises only 1 census tract. Giving half of it is taken by the park, the highways and there are still plenty of office buildings there, it's a quite decent density. I also worked a broader definition, including 4 census tracts adding the Bluff, Craford-Roberts and the Strip districts.
Pittsburgh MSA and Allegheny County growing for the first time since 1950-1960 while the city of Pittsburgh almost ended positive, which would be the first time since 1940-1950. Very promising for the area.


 Prev
Prev


 Linear Mode
