Quote:
Originally Posted by lio45

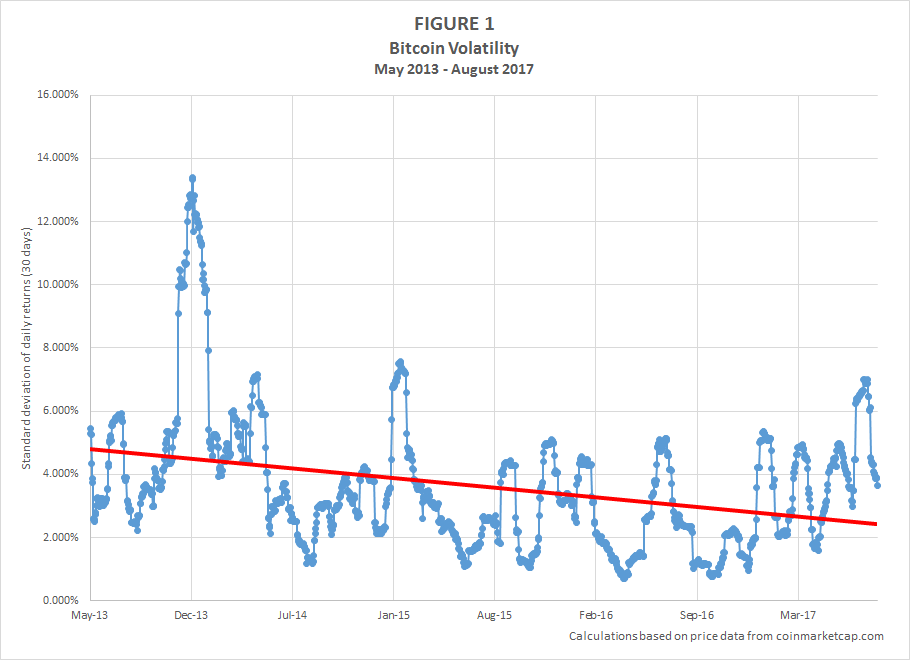
Also, it's worth pointing out that your graph stops a full five years ago! Which is a few eternities ago, in the bitcoin world. How about a graph that covers the past few years? (I'm neutral in this, I don't even know in advance what it would show, but I DO know that it's the freshest data that matters, whatever it says!)
|
The graph conveniently stops just before Bitcoin's value began doubling and tripling y/y.

July 2017 ~$2,700 (all USD)
July 2018 ~$7,000
July 2019 ~$9,000
July 2020 ~$9,000
July 2021 ~$30,000
July 2022 ~ entering at $20,000
The reason why BTC is crazy is because five years ago each was worth under $1K (and in 2016 could be bought for as low as $265), and the price increased to as high as $65K last year. There's plenty of stories of people trading multiple BTCs for, like, pizza delivery prior to 2015.


 Prev
Prev


 Linear Mode
