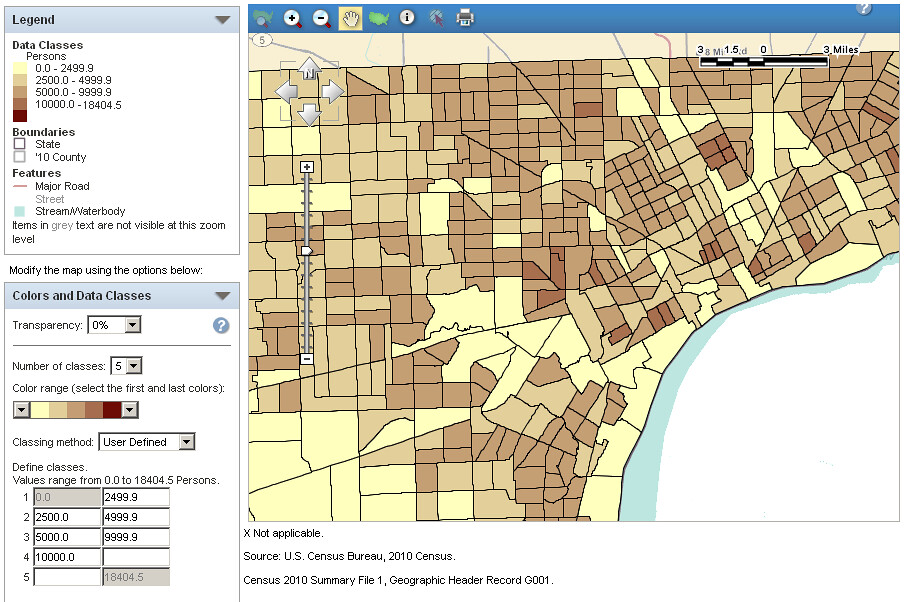
The second set of maps (with smoother gradations in density--at 2500, 5000, 10000 etc.) were more helpful in showing Detroit's overall density than the first set of maps with their sharper gradations. I can now see Detroit has a more consistent density within the 5,000 to 9,999 ppsm density range than, say Houston--which makes sense considering Detroit's average density is around 5,100 ppsm.
That said, the second set of maps also show Houston has several different tracts with peak densities found nowhere within Detroit, and appears to have more land within the 10,000 to 19,999 ppsm density range (as well as more land without any people at all). Phoenix has a similar pattern.


 Prev
Prev


 Linear Mode
