 Posted Jul 10, 2019, 3:59 PM
|
 |
Registered User
|
|
Join Date: Aug 2002
Location: Toronto
Posts: 52,200
|
|
|
What Micro-Mapping a City's Population Density Reveals
What Micro-Mapping a City's Density Reveals
JUL 9, 2019
By Garrett Dash Nelson
Read More: https://www.citylab.com/perspective/...graphy/591760/
Cities 200 Densest Square Kilometres: https://garrettdashnelson.github.io/square-density/
Quote:
Density is one of the most important urban characteristics. A high-density city like New York looks, feels, and functions differently than a low-density city like Des Moines. Yet the textures of density within a single city can be just as varied as average densities between cities. Pockets of intense concentration or islands of relatively thin settlement sometimes bear little resemblance to the overall density of an urban area.
- Since most people experience a city at the scale of a neighborhood or district, rather than the scale of metropolitan regions, paying attention to these fine-grained variations in urban form is more useful than broad-stroke statistics for understanding the everyday realities of population density. A new visualization I’ve put together helps picture these local patterns by examining density in American cities one square kilometer at a time. (Technically, these rectangles are 30 arc-second cells, which are roughly, but not exactly, one square kilometer.) This perspective lets us drill down to the micro-geography of density in American cities, with oftentimes surprising results.
- Most statistics that try to capture a single average measure, after all, tell us fairly little about spread or distribution. Consider economic indicators: If we know that the average income in a country is, say, $55,000, we don’t know anything about whether that country has a lot of middle-class earners or whether it’s polarized between extreme wealth and extreme poverty. — The same problem holds with density. Imagine one city where 50,000 people live in a 5-square-kilometer superblock of high-rises, surrounded by 20 square kilometers of parks, and another city where 50,000 people live in 25 square kilometers of low-density single-family homes. Both cities would have an average density of 2,000 people per square kilometer, but their actual morphologies could hardly be more different.
- Density statistics can be even more misleading than averages like income or age, because the divisor in the equation is a geographic unit that’s inevitably drawn with debatable boundaries. For instance, the Los Angeles metropolitan statistical area (MSA) contains hundreds of square miles of mountains in the San Gabriel National Forest where nobody lives so why shouldn’t the Boston MSA also include the hundreds of square miles of ocean in Boston Harbor where nobody lives? — The Minneapolis–Saint Paul urbanized area includes several large lakes and even a National Wildlife Refuge, so why shouldn’t the Miami urbanized area include some chunk of the Everglades?
- There’s no consistent principle about whether to include uninhabited water, mountains, and deserts when calculating density not to mention airport tarmacs, railroad classification yards, or central business districts with few residences. One alternative way of measuring density involves dividing space up into a regular pattern of equally sized cells, without regard to the underlying physical or administrative features, and then tallying up the population in each cell. That’s exactly what’s available in the Gridded Population of the World dataset produced by NASA. (The European Commission also has a similar dataset called the Global Human Settlement Layer.)
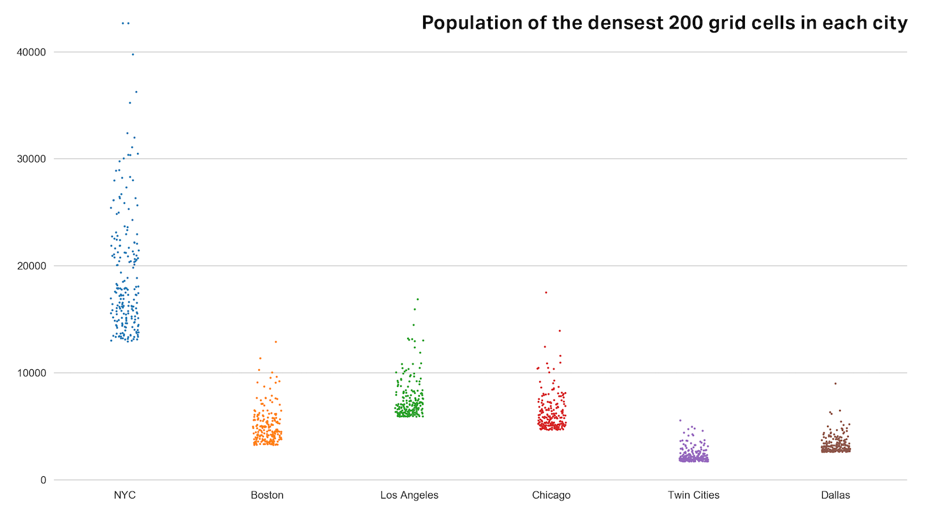
- Another conclusion that we can pick up from this visualization is that New York City really is unlike all of its American peers its density patterns belong in a category all their own. The plot shows the population of the top 200 grid cells in six representative cities, and here you can see just how much of an outlier New York is. The city’s 200th densest cell is denser than the most dense cells of Boston, the Twin Cities, or Dallas. Even Los Angeles and Chicago’s densest areas barely crack into the bottom half of New York’s top 200. — The #1 most dense cell, containing more than 42,000 people in Manhattan, is twice as dense as the #53 densest cell, with 21,000 people in Queens. Yet even that cell is still denser than the densest parts of Los Angeles or Chicago.
- The most provocative lesson to be drawn from thinking about population at the grid scale, however, is that it forces us to think about what we really mean when we talk about dense urban life. Is urban density about tall buildings, traffic congestion, and sharing the name of a city on your mailing address with millions of other people? Or is it more about the small-scale experience of everyday life, the number of neighbors you can reach within walking distance, the form and structure of a local community? — Just as average wealth and income statistics can’t take us very far in explaining how to fairly structure the distribution of economic gain in our society, the average population density of a vast metropolitan area does little to capture the many different ways that we might want to structure our cities and neighborhoods.
.....
|
__________________
ASDFGHJK
|


 Prev
Prev


 Linear Mode
