As we begin 2013 the "year end" stats will start rolling in for 2012, as such I will try to update my graphs, as well as add new ones.
Today I updated the "hotel rooms sold" graph and created a building permit graph...I'll post those here as well as update the first page.
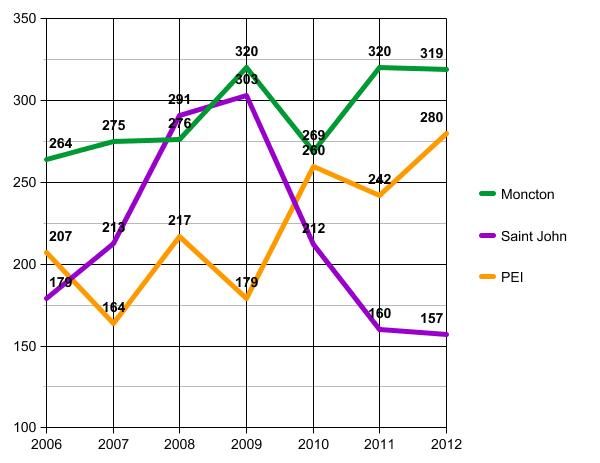
Hotel Nights Sold (in thousands)

Source:
NB Tourism Dept. (Tourism Indicators Summary Report),
NB Tourism Dept. (2012 Tourism Indicators)
In 2012 Moncton had an average hotel occupancy of 59% (up from 58%), Freddy held the line at 57% and Saint John fell to 50% from 52% last year.
Construction
CMA Building Permit Values (in Millions of $) I added PEI as a point of reference as they have similar numbers.
Source:
Statscan