Spent a couple days researching this, here my findings. (Not trying call you out acottawa, just responding to these articles, and sharing some additional findings of my own.)
Quote:
Originally Posted by acottawa

That isn’t what the European Central Bank said
The war added heavily to the inflationary pressures building up in the euro area during the post-pandemic recovery and pushed up consumer prices, especially for energy (Chart 2a) and food. Headline inflation increased from 0.3% in 2020 to 2.6% in 2021 and then to 8.4% in 2022 (Chart 1a). Energy and food inflation accounted for more than two-thirds of this record-high inflation in 2022.
https://www.ecb.europa.eu/press/blog...362af3.en.html. |
This one makes sense. Europe's economy is much more directly tied to both Ukraine and Russia.
Quote:
Originally Posted by acottawa
Or the Bank of Canada
When economies reopened, prices for these commodities spiked suddenly. And because these commodities feed into so many other products and services, the ripple effect on other prices was widespread. Then Russia’s invasion of Ukraine made prices surge even more.
https://www.bankofcanada.ca/2023/03/...igh-inflation/ |
There is one single sentence in that entire article that mentions Ukraine, and they don't share any data about the war in this article. Also, the Bank of Canada printed $600B over two years (adding 30% to our money supply), which is the obvious source of most of our inflation. They would never admit that they caused the inflation, and have every incentive to point to any other source that could've contributed to inflation to make themselves look less guilty. So this one I don't agree with.
Quote:
Originally Posted by acottawa
|
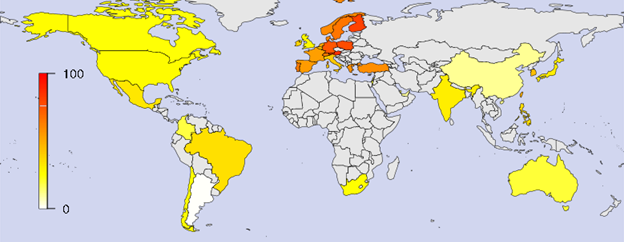
In this article they shared this map, which shows how exposed each country's economy is to the war in Ukraine. As you can see Canada is quite low - appears to be around 5-10%, vs Europe which is 80-100%. Here is their description of what this chart represents:
"This chart depicts the exposure of a country to the Russia-Ukraine war, calculated using the share of firms’ earnings calls mentioning the Russia–Ukraine war, based on the country where the firm is headquartered. Earnings calls’ share is calculated for countries with at least 10 earnings calls between March 1, 2022, and May 13, 2022. Countries with no earnings calls or with less than 10 earnings calls are shown in gray. White indicates that no firm mentions concerns related to the conflict, while deep red indicates 100 percent of firms mentioning concerns related to the conflict."
Quote:
Originally Posted by acottawa
|
This article was published on March 15, 2022 and is entirely forward looking / speculative. All their language is about what they thought the war will do, rather than studying what happened afterwards.
---------
Finally, we must look at the global commodity bubble of late 2021-2022. This was pretty universal across the globe and industries, especially food products. This included both food that is grown in Ukraine/Russia, and food that isn't grown in Ukraine/Russia.
The general trend is that there was a massive runup in 2021 across the board, and it peaked in 2022.
Here are some interesting examples.
Canola - Canada is the top producer, Ukraine is about 4%. Peak came in the winter.
 Rapeseed
 - this is related to canola, Canada is again the top producer, and Canada has virtually all the rapeseed reserves. Not sure why, but other countries ship their rapeseed to Canada, and Canada stores it. Seeing as the peak came in the winter, I don't think this had anythign to do with Ukraine.
 Coffee
 - also peaked in early 2022 after a long runup. Coffee is not grown in Ukraine/Russia.
 Corn
Corn - Ukraine produces around 3.5% of the world's corn. Not the leader, but not nothing either. However compared to how much other commodities went up over this stretch, it doesn't stand out that much. In fact the peak in 2021 reached a similar height.
 Lumber
 - this was a classic bullwhip effect from the pandemic. Nothing t odo with Ukraine. Peak happened at the exact same time as others though.

Wheat - this one is interesting, and might have something to do with the war. Ukraine only produces 2.5% of the world's wheat, but the peak is eerily close to when access to the sea returned.
 Oat
Oat - Russia is the biggest oat producer in the world.
 Steel
Steel - this is more of a Russia comment, since Russia is a big producer of steel. However, steel actually peaked in mid 2021. There was a runup in steel in 2022, but as far as I can tell, the biggest cause of that was China's lockdowns that they were still carrying out during that time. Russia probably did have an effect on that though.
 Potatoes
 - this one I think is being caused by the war. Ukraine and Russia are the 3rd and 4th largest producers in the world. The curve is completely different than all the other charts.
