HomeDiagramsDatabaseMapsForum About
     

Go Back   SkyscraperPage Forum > Regional Sections > United States > Midwest


Reply

 
Thread Tools Display Modes
     
     
  #2021  
Old Posted Dec 30, 2019, 5:41 PM
Handro Handro is offline
Registered User
 
Join Date: May 2017
Location: Chicago
Posts: 1,270
a
Quote:
Originally Posted by LouisVanDerWright View Post
Oh cool, thanks! I was looking for that one too. But the other site I'm trying to find is actual street views.
Reply With Quote
     
     
  #2022  
Old Posted Dec 30, 2019, 6:06 PM
rgarri4's Avatar
rgarri4 rgarri4 is online now
Registered User
 
Join Date: Dec 2016
Location: Chicago
Posts: 1,027
Quote:
Originally Posted by gandalf612 View Post
Made this one its own post since y'all usually want the Adler view larger. Full is linked to my Flickr

December 25, 2019 by Tomasz Wojtasik, on Flickr
__________________
Renderings, Animations, VR
Youtube
Reply With Quote
     
     
  #2023  
Old Posted Dec 30, 2019, 8:21 PM
Steely Dan's Avatar
Steely Dan Steely Dan is offline
devout Pizzatarian
 
Join Date: Jul 2001
Location: Lincoln Square, Chicago
Posts: 29,782
^ 1000M will be one of the most significant gap-fillers in the entire history of our fair city's spectacular skyline.
__________________
"Missing middle" housing can be a great middle ground for many middle class families.
Reply With Quote
     
     
  #2024  
Old Posted Dec 30, 2019, 8:45 PM
IrishIllini IrishIllini is offline
Registered User
 
Join Date: Nov 2015
Posts: 1,176
Quote:
Originally Posted by Handro View Post
a

Oh cool, thanks! I was looking for that one too. But the other site I'm trying to find is actual street views.
You can view “historical” street views on Google, but I think the furthest back you can go is 2007.
Reply With Quote
     
     
  #2025  
Old Posted Jan 2, 2020, 5:37 PM
VivaLFuego's Avatar
VivaLFuego VivaLFuego is offline
Registered User
 
Join Date: Feb 2005
Location: Blue Island
Posts: 6,480
For those into the statistical look at winter (and trying to feel better about being in Chicago for it, sometimes), the Midwest Regional Climate Center does a cool "Accumulated Winter Season Severity Index" by city that updates every day and allows all sorts of historical comparisons. We had a pretty lousy mid-November which got us off to an "Extreme" start, but mildness since then has us now in an "Average" winter and if current forecasts hold, we'll soon be in "Moderate" winter territory in the coming week or so.

https://mrcc.illinois.edu/research/awssi/indexAwssi.jsp

I'd summarize as: Chicago's typical winters are ok and roughly in line with other big cities at/near the same latitude, but we have a long tail in the extremely awful direction (e.g. winters of 1978-79, 2013-14) which stand out in people's memory and impressions. As with many things in life, the 90th and 95th percentile cases are important for human perception and decision-making even if not for day to day life, and our 95th percentile for winter awfulness is pretty bad even if our 50th percentile is fine.
Reply With Quote
     
     
  #2026  
Old Posted Jan 3, 2020, 4:41 PM
Steely Dan's Avatar
Steely Dan Steely Dan is offline
devout Pizzatarian
 
Join Date: Jul 2001
Location: Lincoln Square, Chicago
Posts: 29,782
Quote:
Originally Posted by rivernorthlurker View Post
Before 2009 there were 10 800+ footers completed and 13 700+. When WPS breaks ground it will double it up to the 20th 800+ built and u/c and 29 for 700+. Almost hard to believe!
yeah, the greater number of taller towers is really the most exciting part of this building boom, IMO.

as you can see on the chart below, there have been bigger booms for buildings over 150m in chicago, but it's the upper end height that's really making this one stand out.


source: chart made by me based on CTBUH data
__________________
"Missing middle" housing can be a great middle ground for many middle class families.
Reply With Quote
     
     
  #2027  
Old Posted Jan 3, 2020, 5:14 PM
Baronvonellis Baronvonellis is offline
Registered User
 
Join Date: Sep 2009
Location: Chicago
Posts: 880
I saw this really cool documentary called The World's Greatest Fair on Amazon Prime. It's about the 1904 St. Louis Worlds Fair, but I imagine it would be similar to the 1893 Chicago Fair, as they said St. Louis tried to one up Chicago, and this one was bigger. I haven't seen an in depth documentary about the 1893 fair that I know of.
They discussed the Chicago fair quite a bit, and show the history of the Ferris Wheel. St. Louis bought the 1893 Chicago wheel, and then dynamited it at end lol. It's a shame that no city wanted the wheel and they just sold it for scrap.
Reply With Quote
     
     
  #2028  
Old Posted Jan 3, 2020, 6:05 PM
maru2501's Avatar
maru2501 maru2501 is offline
Registered User
 
Join Date: Oct 2015
Location: chicago
Posts: 1,668
Quote:
Originally Posted by Steely Dan View Post
^ 1000M will be one of the most significant gap-fillers in the entire history of our fair city's spectacular skyline.
Truly. Especially considering how much Essex stood out. Glad to see the framing of grant park continue so hard
Reply With Quote
     
     
  #2029  
Old Posted Jan 3, 2020, 6:50 PM
Ricochet48 Ricochet48 is offline
Registered User
 
Join Date: Oct 2017
Location: River North, Chicago
Posts: 189
Wow thanks so much for that rendering. One can dream!

I cycle a lot to the planetarium and that view would be even better!
Reply With Quote
     
     
  #2030  
Old Posted Jan 3, 2020, 7:02 PM
HomrQT's Avatar
HomrQT HomrQT is offline
All-American City Boy
 
Join Date: Dec 2009
Location: Hinsdale / Uptown, Chicago
Posts: 1,939
Quote:
Originally Posted by Steely Dan View Post
yeah, the greater number of taller towers is really the most exciting part of this building boom, IMO.

as you can see on the chart below, there have been bigger booms for buildings over 150m in chicago, but it's the upper end height that's really making this one stand out.


source: chart made by me based on CTBUH data
I know you don't normally include NYC in your numbers because they have been at such an outrageous pace for such a long time, but it would still be interesting to see them in this format...
__________________
1. 9 DeKalb Ave - Brooklyn, NYC - SHoP Architects - Photo
2. American Radiator Building - New York City - Hood, Godley, and Fouilhoux - Photo
3. One Chicago Square - Chicago - HPA and Goettsch Partners - Photo
4. Chicago Board of Trade - Chicago - Holabird & Root - Photo
5. Cathedral of Learning - Pittsburgh - Charles Klauder - Photo
Reply With Quote
     
     
  #2031  
Old Posted Jan 3, 2020, 10:36 PM
Steely Dan's Avatar
Steely Dan Steely Dan is offline
devout Pizzatarian
 
Join Date: Jul 2001
Location: Lincoln Square, Chicago
Posts: 29,782
^ here are the charts for the northeast and midwest, for comparisons:


source: chart made by me based on CTBUH data


source: chart made by me based on CTBUH data


chicago has been really solid over the past 2 decades, but NYC has gone absolutely apeshit.
__________________
"Missing middle" housing can be a great middle ground for many middle class families.

Last edited by Steely Dan; Jan 3, 2020 at 10:47 PM.
Reply With Quote
     
     
  #2032  
Old Posted Jan 4, 2020, 12:17 AM
rivernorthlurker rivernorthlurker is offline
Registered User
 
Join Date: Dec 2018
Location: Chicago
Posts: 1,107
Quote:
Originally Posted by Steely Dan View Post
^ here are the charts for the northeast and midwest, for comparisons:


chicago has been really solid over the past 2 decades, but NYC has gone absolutely apeshit.
As has the entire world. via: https://www.skyscrapercenter.com/year-in-review/2019

Reply With Quote
     
     
  #2033  
Old Posted Jan 4, 2020, 12:20 AM
rivernorthlurker rivernorthlurker is offline
Registered User
 
Join Date: Dec 2018
Location: Chicago
Posts: 1,107
Quote:
Originally Posted by Steely Dan View Post
yeah, the greater number of taller towers is really the most exciting part of this building boom, IMO.

as you can see on the chart below, there have been bigger booms for buildings over 150m in chicago, but it's the upper end height that's really making this one stand out.


source: chart made by me based on CTBUH data
Great chart! 
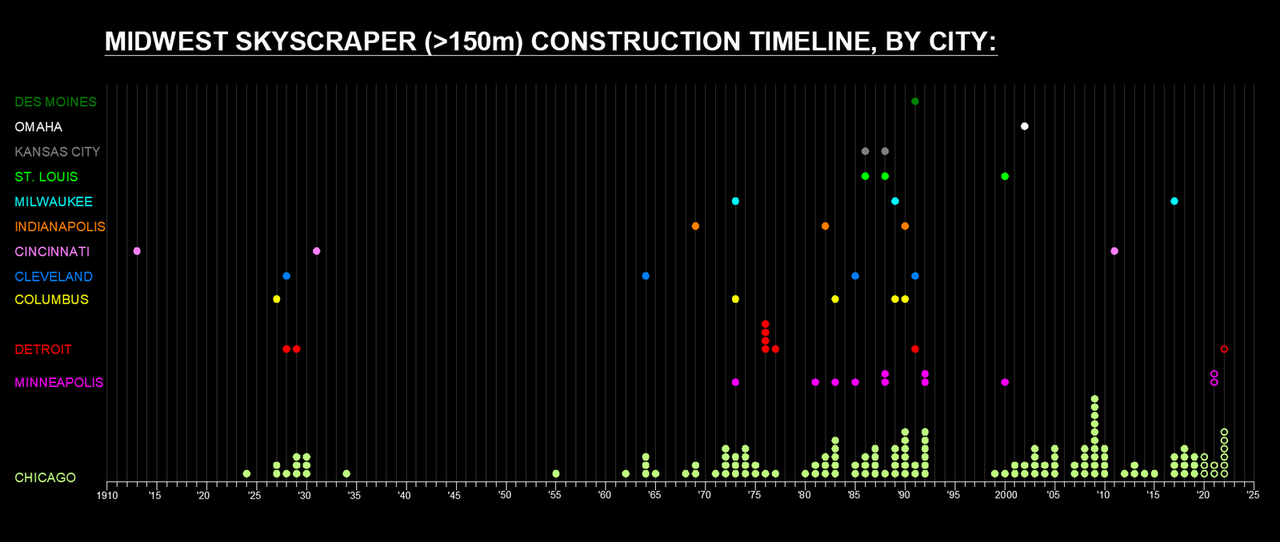
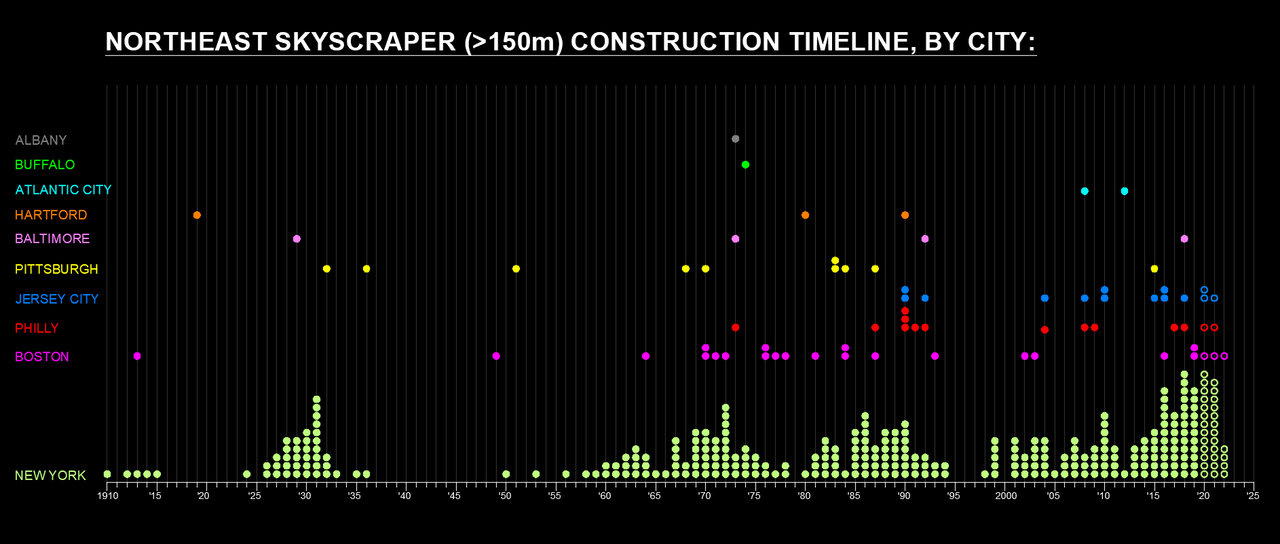
I was wondering where to get some raw data for skyscrapers for free. Does CTBUH have it in csv or comparable format?

Also what software/language/library did you use to make that chart?
Reply With Quote
     
     
  #2034  
Old Posted Jan 4, 2020, 12:32 AM
rivernorthlurker rivernorthlurker is offline
Registered User
 
Join Date: Dec 2018
Location: Chicago
Posts: 1,107
Ok triple post...

Additionally 1000M puts Chicago ahead of HK in the 250m+ category 17 to 16 which I found surprising/amazing. Chicago has done a lot of catching up in that height class the last decade. And given the situation in HK doesn't seem like they will be making a run anytime soon.

WPS will make it 18 if they use the 835 ft measurement. Legacy and 110 Wacker are also like < 2 m short of this mark.

via https://en.wikipedia.org/wiki/List_o...tion_inclusive)

Reply With Quote
     
     
  #2035  
Old Posted Jan 4, 2020, 1:29 AM
marothisu marothisu is offline
Registered User
 
Join Date: Dec 2012
Location: Chicago
Posts: 6,883
Quote:
Originally Posted by rivernorthlurker View Post
Ok triple post...

Additionally 1000M puts Chicago ahead of HK in the 250m+ category 17 to 16 which I found surprising/amazing. Chicago has done a lot of catching up in that height class the last decade. And given the situation in HK doesn't seem like they will be making a run anytime soon.
Hong Kong is probably the biggest "reality isn't what the media portrays it as" city I've ever been to in the world. Hong Kong has the most high rises in the world of any city, but when you're talking about really, really tall buildings, it doesn't do even close to as well as most people think. They have a ton of buildings between the 150M and 200M mark - basically let's say the 48 story to
65 story range. Also, HK is mountainous so it makes it feel like there are sometimes taller buildings on some areas than reality.
__________________
Chicago Maps:
* New Construction https://www.google.com/maps/d/viewer...B0&usp=sharing
Reply With Quote
     
     
  #2036  
Old Posted Jan 4, 2020, 2:08 AM
Steely Dan's Avatar
Steely Dan Steely Dan is offline
devout Pizzatarian
 
Join Date: Jul 2001
Location: Lincoln Square, Chicago
Posts: 29,782
Quote:
Originally Posted by rivernorthlurker View Post

Also what software/language/library did you use to make that chart?
Nothing fancy, just plotted the data out the old-fashioned way in AutoCAD.

It's a fine way to kill a lunch hour.
__________________
"Missing middle" housing can be a great middle ground for many middle class families.

Last edited by Steely Dan; Jan 4, 2020 at 2:21 AM.
Reply With Quote
     
     
  #2037  
Old Posted Jan 4, 2020, 2:20 AM
HomrQT's Avatar
HomrQT HomrQT is offline
All-American City Boy
 
Join Date: Dec 2009
Location: Hinsdale / Uptown, Chicago
Posts: 1,939
Quote:
Originally Posted by Steely Dan View Post
chicago has been really solid over the past 2 decades, but NYC has gone absolutely apeshit.
Freaking insane. According to your data, 2009 was a heck of a year for Chicago, paired with 2010 made a good run.
__________________
1. 9 DeKalb Ave - Brooklyn, NYC - SHoP Architects - Photo
2. American Radiator Building - New York City - Hood, Godley, and Fouilhoux - Photo
3. One Chicago Square - Chicago - HPA and Goettsch Partners - Photo
4. Chicago Board of Trade - Chicago - Holabird & Root - Photo
5. Cathedral of Learning - Pittsburgh - Charles Klauder - Photo

Last edited by HomrQT; Jan 4, 2020 at 6:52 PM.
Reply With Quote
     
     
  #2038  
Old Posted Jan 5, 2020, 6:08 PM
Tom In Chicago's Avatar
Tom In Chicago Tom In Chicago is offline
Moderator
 
Join Date: Jul 2001
Location: Sick City
Posts: 7,303
Quote:
Originally Posted by Steely Dan View Post
Nothing fancy, just plotted the data out the old-fashioned way in AutoCAD.

It's a fine way to kill a lunch hour.
Great work as usual Dan. . . thanks for posting. . . wondering if it would be too hard to look at "the rest of the US" in this context. . . hmmm. . .

. . .
__________________
Tom in Chicago
. . .
Near the day of Purification, there will be cobwebs spun back and forth in the sky.
Reply With Quote
     
     
  #2039  
Old Posted Jan 9, 2020, 7:08 PM
BrinChi BrinChi is offline
Registered User
 
Join Date: Jun 2013
Location: Chicago, IL
Posts: 446
Where are Illinoisans moving to?

https://www.chicagobusiness.com/opin...is-hello-where


The adjusted gross income of Illinois taxpayers who didn’t migrate averaged $78,959. Illinois has been losing high-income residents (a lot of them retirees, one imagines) to Florida, middle-income residents to the South and West, and those with lower incomes to neighboring states. Also, the top two destinations for Illinois migrants are the top two for the nation as a whole, with Florida first, Texas second.

Domestic migration statistics are frequently cited as evidence of the failures of blue-state governance, in particular the higher taxes imposed by states that are losing lots of residents. There’s something to that—income-tax-free Florida sure is attracting a lot of affluent people from Illinois and New York, and a recent study of high-income California taxpayers concluded that a 2012 income tax increase there did in fact drive some away. But California, Illinois and New York have all experienced bigger per capita personal income gains than the nation as a whole since the beginning of 2010, and all saw taxpayers with incomes below $50,000 overrepresented among the leavers from 2011 through 2018. These departures may indicate failures of governance as well, but it’s a different set of governance failures, presumably related more to housing costs, commutes and job opportunities than taxes per se.

There also isn’t much evidence in the IRS data—yet—of an exodus of high-income taxpayers hit by the state-and-local-tax-deduction limits imposed by the 2017 tax bill. That is, the number of taxpayers with adjusted gross incomes of $200,000 or more leaving for other states actually fell in high-tax California, Connecticut, Illinois, New Jersey and New York from 2017 to 2018, the year the cap went into effect. Those who ended up with higher tax bills due to the change generally didn’t find out exactly how much higher until 2019, though, so it may just be too early to tell.
Reply With Quote
     
     
  #2040  
Old Posted Jan 10, 2020, 8:58 PM
Handro Handro is offline
Registered User
 
Join Date: May 2017
Location: Chicago
Posts: 1,270
Quote:
Originally Posted by BrinChi View Post
Where are Illinoisans moving to?

https://www.chicagobusiness.com/opin...is-hello-where


The adjusted gross income of Illinois taxpayers who didn’t migrate averaged $78,959. Illinois has been losing high-income residents (a lot of them retirees, one imagines) to Florida, middle-income residents to the South and West, and those with lower incomes to neighboring states. Also, the top two destinations for Illinois migrants are the top two for the nation as a whole, with Florida first, Texas second.

Domestic migration statistics are frequently cited as evidence of the failures of blue-state governance, in particular the higher taxes imposed by states that are losing lots of residents. There’s something to that—income-tax-free Florida sure is attracting a lot of affluent people from Illinois and New York, and a recent study of high-income California taxpayers concluded that a 2012 income tax increase there did in fact drive some away. But California, Illinois and New York have all experienced bigger per capita personal income gains than the nation as a whole since the beginning of 2010, and all saw taxpayers with incomes below $50,000 overrepresented among the leavers from 2011 through 2018. These departures may indicate failures ofgovernance as well, but it’s a different set of governance failures, presumably related more to housing costs, commutes and job opportunities than taxes per se.

There also isn’t much evidence in the IRS data—yet—of an exodus of high-income taxpayers hit by the state-and-local-tax-deduction limits imposed by the 2017 tax bill. That is, the number of taxpayers with adjusted gross incomes of $200,000 or more leaving for other states actually fell in high-tax California, Connecticut, Illinois, New Jersey and New York from 2017 to 2018, the year the cap went into effect. Those who ended up with higher tax bills due to the change generally didn’t find out exactly how much higher until 2019, though, so it may just be too early to tell.
Old people moving south upon retirement. In other news...
Reply With Quote
     
     
This discussion thread continues

Use the page links to the lower-right to go to the next page for additional posts
 
 
Reply

Go Back   SkyscraperPage Forum > Regional Sections > United States > Midwest
Forum Jump


Forum Jump


All times are GMT. The time now is 2:15 AM.

     
SkyscraperPage.com - Archive - Privacy Statement - Top

Powered by vBulletin® Version 3.8.7
Copyright ©2000 - 2024, vBulletin Solutions, Inc.